Figure 1.

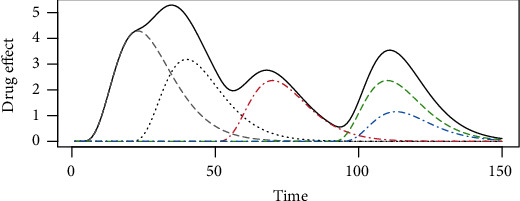
The drug effect of each drug entry. The black solid line represents the cumulative effect, and the dashed lines represent each drug entry.

The drug effect of each drug entry. The black solid line represents the cumulative effect, and the dashed lines represent each drug entry.