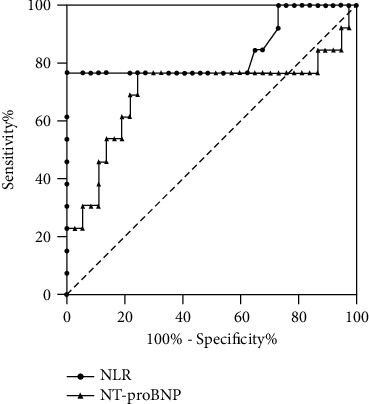
Figure 1.

ROC of MACE in elderly CHF patients was assessed by different indicators (the closer the curve is to the upper left corner of the picture, the higher the prediction value will be. If the curve is lower than the reference line area, it means that the indicator has no prediction significance).
