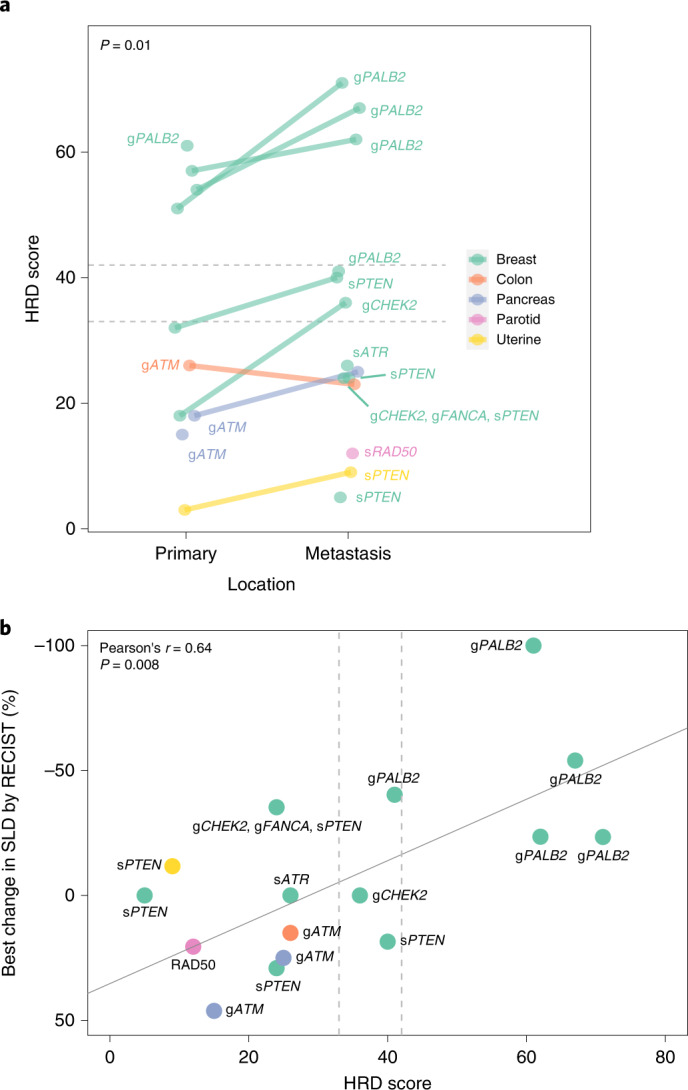
Fig. 2. Tumor HRD scores and correlation with treatment response.

HRD score was obtained by NGS assay (Myriad myChoice) from tumor biopsies (n = 15 patients; 2 patients excluded for insufficient sample and 2 patients excluded for assay failure). a, HRD score is plotted in primary and metastatic samples for all evaluable patients with lines connecting paired samples. Horizontal dashed lines indicate an HRD score threshold of ≥33 (captures 99% of known BRCA1- and/or BRCA2-deficient ovarian cancers) or ≥42 (captures 95% of known BRCA1- and/or BRCA2-deficient ovarian cancers). Significance testing by paired t-test for primary versus metastatic HRD scores. b, Correlation of HRD score with talazoparib treatment response. HRD score is plotted against best change in SLD by RECIST. Pearson’s correlation is indicated by the solid line, with associated r and two-sided P value denoted. Vertical dashed lines indicate an HRD threshold of ≥33 or ≥42. In cases where patients had more than one HRD score (for example, due to assay of primary and metastatic tumors), the higher score was used.
