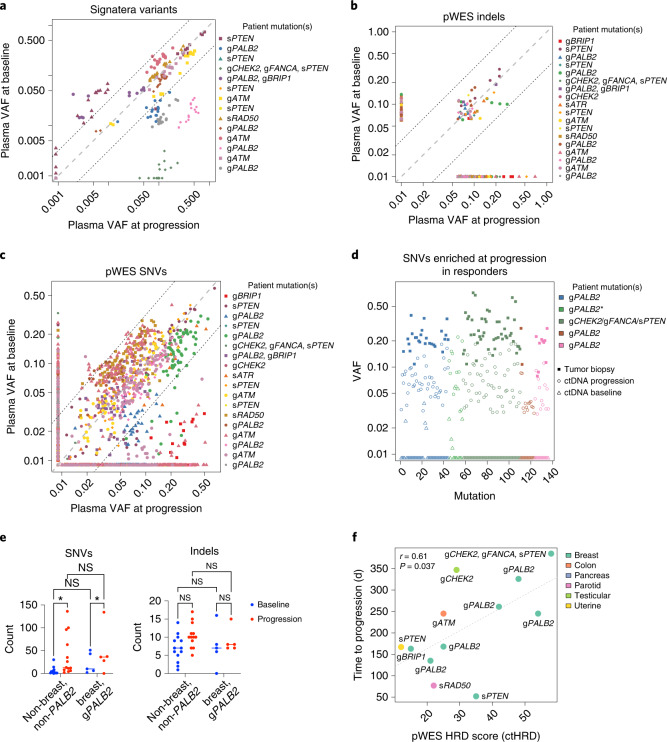
Fig. 4. ctDNA variants and ctHRD score correlating with treatment outcomes.
a, Variants detected by Signatera assay of baseline and progression ctDNA samples plotted by VAF. Dashed lines represent fivefold difference cutoffs, n = 14 patients. b, pWES-identified indels (n = 18 patients) at baseline and progression. c, SNVs identified by pWES at baseline and progression (n = 18 patients). d, Deleterious SNVs enriched fivefold in progression samples (n = 6 patients) from responders (decrease of >20% in SLD) compared to baseline. Variants identified in tumor WES are shown (an anterisk indicates insufficient sample for tumor WES). e, ctDNA SNV counts are significantly increased in progression samples compared to control samples (n = 18 patients), whereas there is no significant difference in indel counts (two-way ANOVA with Tukey’s correction, *P = 0.033; median indicated by horizontal line). NS, not significant. f, scarHRD was used to calculate ctHRD score from baseline pWES and correlated with time to progression in days. The correlation coefficient (r) and two-sided P value were calculated with Pearson’s method and are depicted as a dashed line. n = 12 patients.

