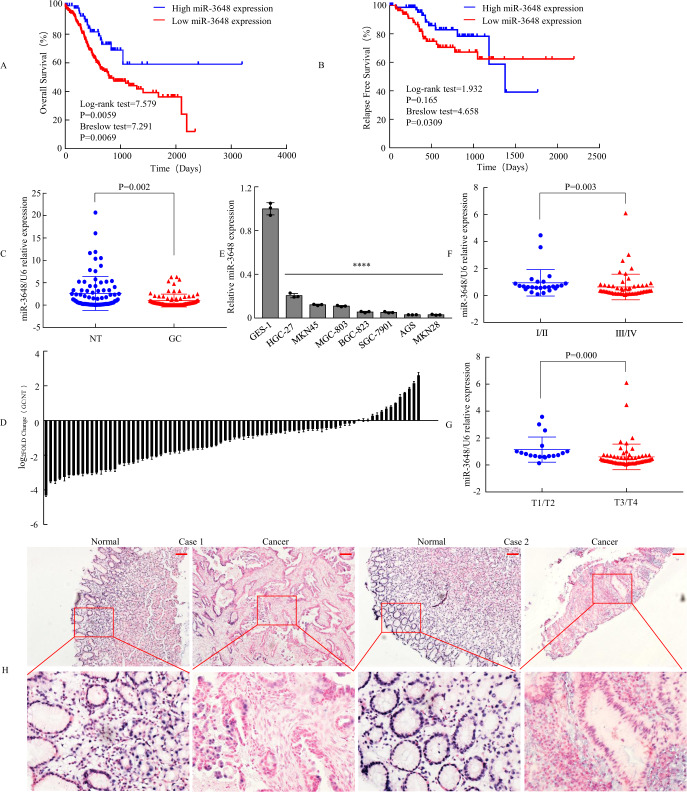
Fig. 1. miR-3648 expression was associated with prognosis and downregulated in GC.
A, B Survival analyses of overall survival (OS) and relapse-free survival (RFS) were performed based on Kaplan–Meier curves in oncomir database. C Expression of miR-3648 was determined by qPCR in 82 human gastric tissues, which was normalised against an endogenous U6 RNA control. NT normal mucosal tissues, GC GC tissue. ***P < 0.01, paired t-test. D Relative miR-3648 levels of GC and normal tissues measured by qPCR were shown using a waterfall plot. Error bars represent the mean ± SD from three independent experiments. E miR-3648 expressions in eight gastric epithelial cell lines by qPCR. One-way ANOVA and Dunnett’s T3 multiple comparison test. ****P < 0.001 between normal and cancer gastric epithelial cells. The result is presented as the mean ± SD of three independent experiments. F, G The relationship between miR-3648 expression and clinical stages or local invasion. ***P < 0.01; ****P < 0.001. P values were estimated using two-tailed unpaired Student’s t-test. H ISH analysis of miR-3648 expression level in normal gastric mucosa and GC tissues. Scale bars, 100 μm in H.

