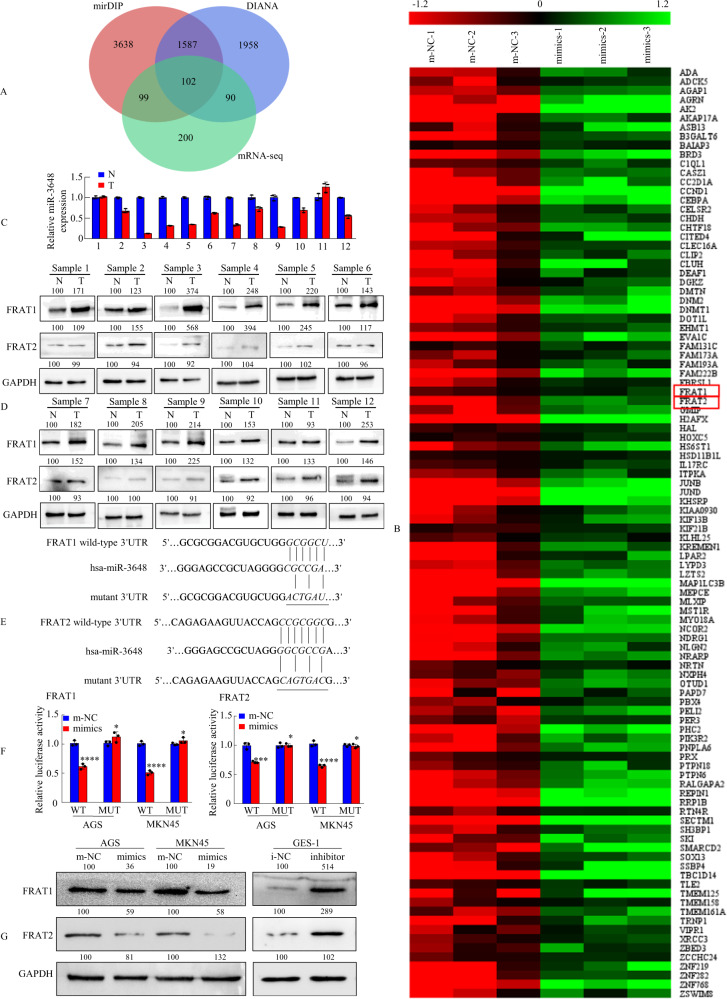
Fig. 3. miR-3648 directly targets FRAT1 or FRAT2 in GC cells.
A The three-way Venn diagram indicated the numbers of genes that overlapped in two publicly available bioinformatics algorithms (mirDIP and DIANA) and RNA sequencing-based miR-3648 signature. B The heatmap was based on 102 candidate genes that were downregulated in AGS cells. Red colour represents an expression level above mean, green colour represents an expression lower than the mean. Highlighted by red box. C miR-3648 level and D FRAT1/FRAT2 protein expression levels in twelve freshly collected gastric mucosal tissues using qRT-PCR and western blot analyses. Error bars represent the mean ± SD from three independent experiments. E Putative miR-3648-binding sequence within the 3′-UTR of FRAT1 or FRAT2 mRNA. Mutations in the complementary site for the seed region of miR-3648 in the 3′-UTR of the FRAT1 or FRAT2 gene are indicated. F Luciferase reporter vectors containing wild-type (wt) or mutant (mut) FRAT1 or FRAT2 3′-UTR were constructed and cotransfected with miR-3648 mimics into AGS and MKN45 cells. Luciferase reporter assays were used to determine whether miR-3648 directly binds to the 3′-UTR of FRAT1 or FRAT2. *P > 0.05, ***P < 0.01 and ****P < 0.001, m-NC vs. mimics. Error bars represent the mean ± SD from three independent experiments. P values were estimated using two-tailed unpaired Student’s t-test. G Western blot analysis of FRAT1 or FRAT2 levels in gastric epithelial cells treated with miR-3648 mimic or inhibitor.

