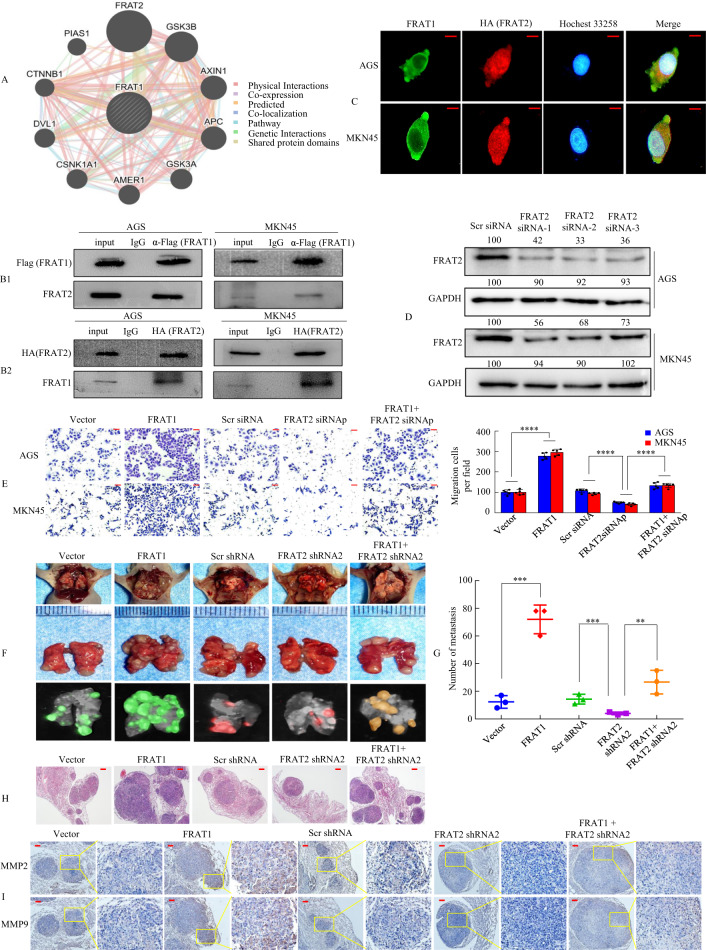
Fig. 5. FRAT1 synergises with FRAT2 to promote tumour invasion and metastasis.
A Potential FRAT2 binding partners were predicted using the GeneMANIA database. The red boxes represent protein–protein interactions. B1, B2 Interaction between FRAT1 and FRAT2 in GC cells. Flag-tagged FRAT1 (B1) or HA-tagged FRAT2 (B2) plasmid was transfected into cells. Immunoprecipitation was performed with Flag-tagged FRAT1 or HA-tagged FRAT2 antibody, and pre-immune normal mouse immunoglobulin G (nm IgG) was used as a control. Western blot analysis was performed with an anti-FRAT2 (α-FRAT2) or anti-FRAT1 (α-FRAT1) antibody. C Double staining of FRAT1 (green) and HA-FRAT2 (red) in GC cells was visualised by confocal microscopy; nuclei were counterstained with Hoechst 33258. D The protein levels of FRAT2 in AGS and MKN45 cells with four treatments [Scrambled (Scr) siRNA, FRAT2 siRNA 1, FRAT2 siRNA 2 and FRAT2 siRNA 3] were determined by western blot analysis. E In vitro the invasive ability of AGS and MKN45 cells were evaluated by Tranwell assay. siRNAp, siRNApool. ****P < 0.001. Error bars represent the mean ± SD. P values were estimated using two-tailed unpaired Student’s t-test. F Mice were orthotopically transplanted with MKN45 cells (n = 3 in each group, one of three nude mice was shown). Error bars represent the mean ± SD. P values were estimated using two-tailed unpaired Student’s t-test. G Metastatic cancer tissues were stained with H&E. H The number of metastatic loci in the lungs was counted. **P < 0.05; ***P < 0.01. I IHC staining of MMP2 and MMP9 expression. The scale bars represent 20 μm in C, 50 μm in E, 200 μm in G and 100 μm in I.

