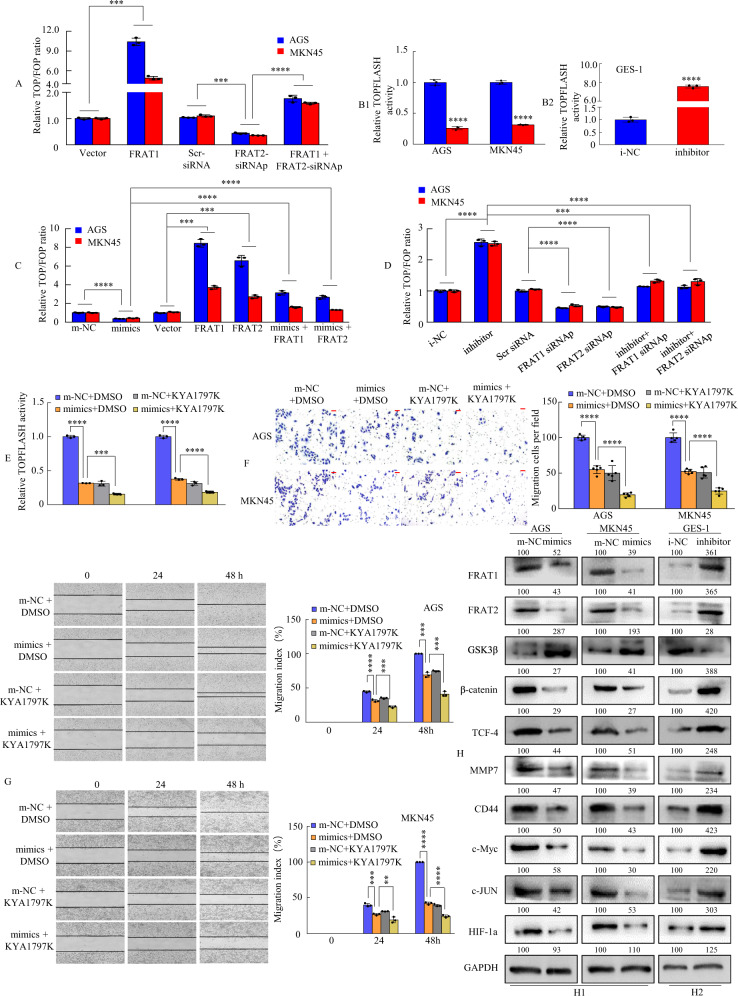
Fig. 6. miR-3648 suppressed the activation of Wnt-β-catenin signalling by targeting FRAT1/2 in vitro.
A The GC cells were cotransfected with Vector, or FRAT1, or Scr siRNA, or FRAT2 siRNAp, or FRAT1 + FRAT2 siRNAp and TOP/FOPflash reporter plasmid were measured 48 h, and the luciferase activity was determined. Normalised to Renilla luciferase activity used as an internal control. ***P < 0.01; ****P < 0.001. Two-tailed unpaired Student’s t-test. B1, B2 miR-3648-modulated GC cells were transfected with the TOP/FOPflash reporter plasmid, and the reporter activities were determined 48 h. ****P < 0.001; ****P < 0.001. Two-tailed unpaired Student’s t-test. C The GC cells were cotransfected with m‐NC, or miR‐3648, or Vector, or FRAT1, or FRAT2, or miR‐3648 + FRAT1, or miR‐3648 + FRAT2 and TOP/FOPflash reporter plasmid. Then, Luciferase activity was tested 48 h later. ***P < 0.01; ****P < 0.001. Two-tailed unpaired Student’s t-test. D The GC cells were cotransfected, and the luciferase activity was measured after 48 h. Normalised Renilla luciferase activity was used as an internal control. ***P < 0.01; ****P < 0.001. Two-tailed unpaired Student’s t-test. E The GC cells were cotransfected with 100 ng of TopFlash or FOPFlash luciferase reporter and m-NC + DMSO, or miR-3648 + DMSO, or m-NC + KYA1797K, or miR-3648 + KYA1797K, then treated for 48 h. Luciferase activity was measured. ***P < 0.01; ****P < 0.001. Two-tailed unpaired Student’s t-test. F, G Effects of m-NC + DMSO, or miR-3648 + DMSO, m-NC + KYA1797K, or miR-3648 + KYA1797K on GC cells migration and invasion using transwell and wound-healing assay. **P < 0.05; ***P < 0.01; ****P < 0.001. Two-tailed unpaired Student’s t-test. All experiments were repeated at least three times. H1, H2 Western blot analysis of ten protein expressions in GC cells transfected with miR-3648 mimics or miR-3648 inhibitor. Cells transfected with control (NC) plasmids were used as a control. The densitometry data presented below the bands are fold change compared with control. Scale bars, 50 μm in F.

