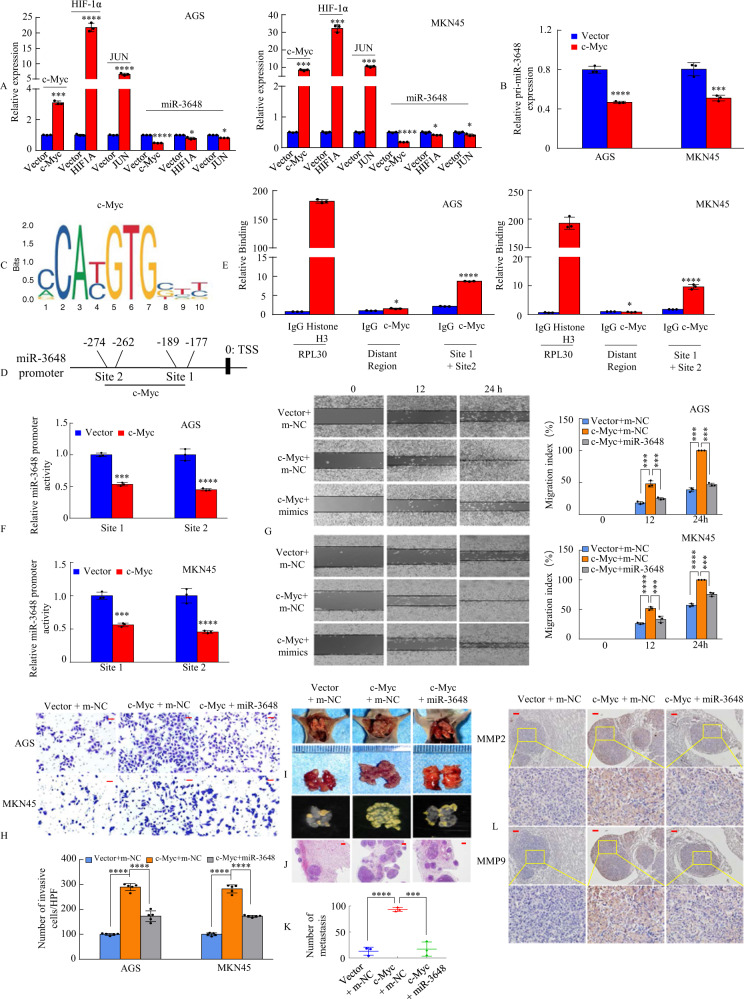
Fig. 7. miR-3648 is regulated directly by the transcription factor c-Myc.
A, B Overexpression of c-Myc, or HIF-1a, or JUN, or Vector was transfected into AGS and MKN45 cells. c-Myc, or HIF-1a, or JUN, or mature miR-3848 (A), or pri-miR-769 (B) relative expression levels were detected in AGS and MKN45 cell lines using qRT-PCR analysis. *P > 0.05; ***P < 0.01; ****P < 0.001. Two-tailed unpaired Student’s t-test. C The transcriptional factor c-Myc binding motif was predicted using Jaspar database. D The luciferase (Luc) reporter constructs contained the miR-3648 promoter with two potential c-Myc-binding sites. E ChIP-qPCR assay demonstrated the direct binding of c-Myc to the miR-3648 promoter in AGS and MKN45 cells. Gene enrichment was quantified relative to input controls by qPCR using primers specific for the promoter regions of miR-3648. PCR primers located in exon 3 of RPL30 and anti-Histone H3 antibody served as the positive control. Primers were used to amplify the served region containing the distant upstream miR-3648 promoter as the background. Results are shown as a fold change of qPCR value over IgG. Two-tailed unpaired Student’s t-test; *P > 0.05 and ****P < 0.001. F c-Myc transrepresses miR-3648 promoter activities in AGS and MKN45 cells. The miR-3648 promoter construct was cotransfected with c-Myc or vector, and the relative luciferase activity was determined. ***P < 0.01; ****P < 0.001. Two-tailed unpaired Student’s t-test. G, H The GC cell migration and invasion assays were performed. ***P < 0.01; ****P < 0.001. Two-tailed unpaired Student’s t-test. All experiments were repeated at least three times. I Mice were orthotopically transplanted with MKN45 cells (n = 3 in each group, one of three nude mice was shown. ***P < 0.01; ****P < 0.001. Two-tailed unpaired Student’s t-test. J The mice were killed and metastatic cancer tissues were stained with H&E. K The number of metastatic loci in the lungs was counted. ***P < 0.01; ****P < 0.001. L IHC staining of MMP2 and MMP9 expression. Scale bars, 50 μm in H, 200 μm in J and 100 μm in L.

