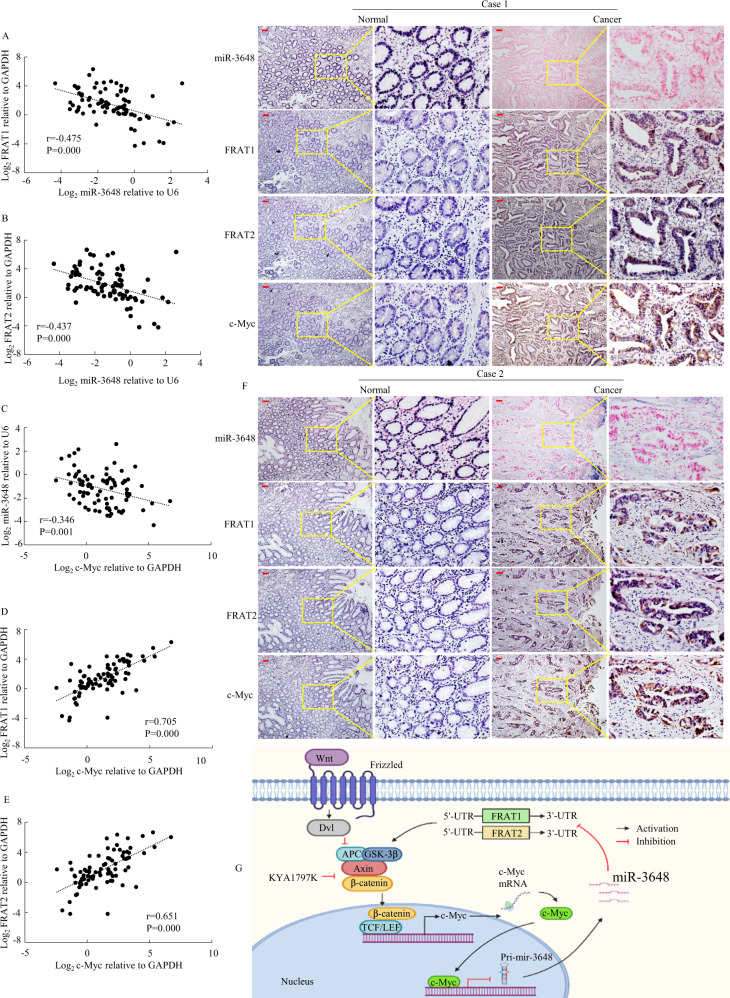
Fig. 8. The correlation among expression of c-Myc, miR-3648, FRAT1 and FRAT2 in GC.
A–E Spearman’s correlation analysis was used to determine the relationship between miR-3648 and FRAT1, that between miR-3648 and FRAT2, that between c-Myc and miR-3648, that between miR-3648 and FRAT1, and that between c-Myc and FRAT2 expression in 82 GC tissues using qPCR assay. F miR-3648, FRAT1, FRAT1 and c-Myc expression levels were detected by ISH and IHC assay. These figures were the representatives of gastric tissues from twelve cancerous and noncancerous patients. Scale bars, 50 μm. G A hypothetical model depicting roles of miR-3648, FRAT1, FRAT2 and c-Myc in GC cells.

