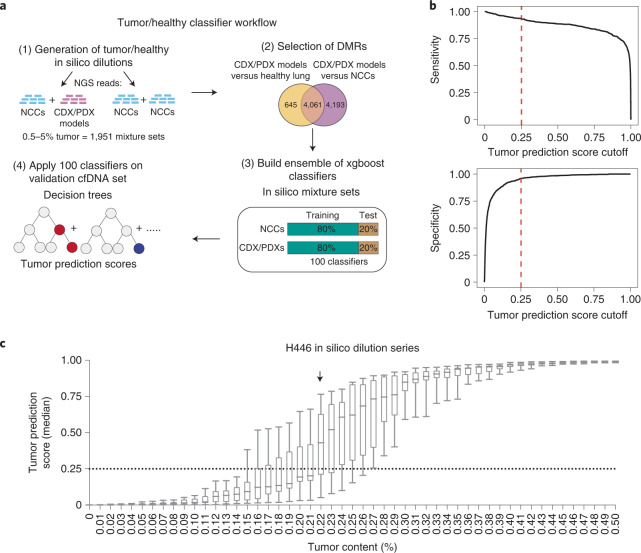
Fig. 2. Generation of a DNA methylation classifier for sensitive tumor detection.
a, Analysis workflow for the generation of the tumor/healthy classifier. b, Sensitivity and specificity metrics plotted against cutoff values for the median tumor prediction score output by the tumor/healthy classifier applied to held-out synthetic mixture sets (total of n = 1,951 mixture sets). Dotted lines indicate the cutoff value (0.25) that optimizes the balanced accuracy metric (average of sensitivity and specificity). c, Box plots of median tumor prediction scores from applying the tumor/healthy classifier to in silico serial dilutions of a fragmented SCLC cell line (H446) mixed with an NCC cfDNA sample, with varying proportions of the cell line in the mixture (x axis). For each proportion, 11 independent in silico dilution experiments were carried out. Boxes mark the 25th percentile (bottom), median (central bar) and 75th percentile (top); whiskers extend to minimum and maximum points. Dotted line indicates the cutoff for the tumor/healthy classifier derived as above. Arrow indicates the lowest dilution of H466 with a median value (across the 11 in silico experiments) above this cutoff (0.22% tumor content).

