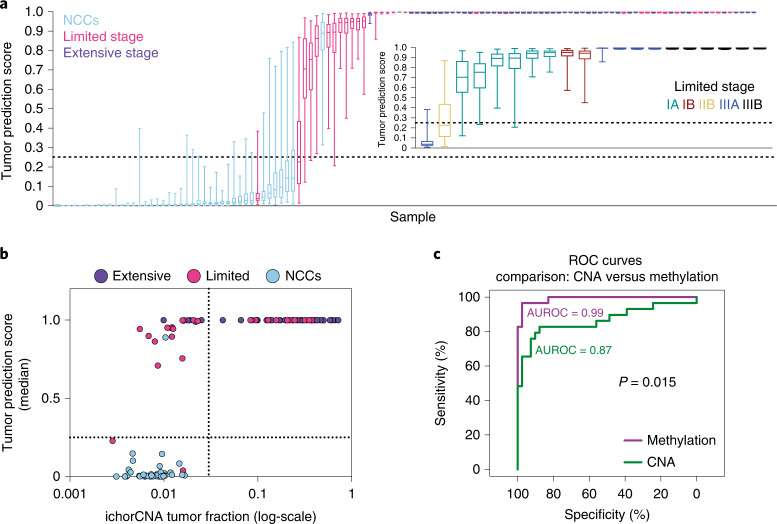
Fig. 3. Methylation tumor prediction score applied to SCLC cfDNA samples.
a, Box plots of classifier tumor prediction scores for 78 held-out SCLC cfDNA samples (29 limited stage and 49 extensive stage) and 41 held-out NCC cfDNA samples from applying the 100 classifiers trained on CDX/PDX synthetic spike-in samples. Boxes mark the 25th percentile (bottom), median (central bar) and 75th percentile (top); whiskers extend to minimum and maximum points. Dotted lines indicate the tumor prediction score cutoff value of 0.25. Inset plot shows tumor prediction scores for 20 out of 29 limited stage patients who had detailed staging information available. b, Scatter-plot showing median classifier tumor prediction scores against ichorCNA tumor fraction values (on a log scale) for the 78 SCLC and 41 NCC cfDNA samples. The classifier tumor prediction scores are correlated with ichorCNA tumor fraction (Spearman’s ρ = 0.72). Dotted lines are indicating the cutoff for both measures. c, ROC curves and AUROC scores generated by using ichorCNA tumor fraction (CNA, green line) or median classifier tumor prediction score (methylation, purple line) to classify LS-SCLC (n = 29) and NCC cfDNA (n = 41) samples. P value is from a comparison of the AUROC scores using a two-sided DeLong’s test.

