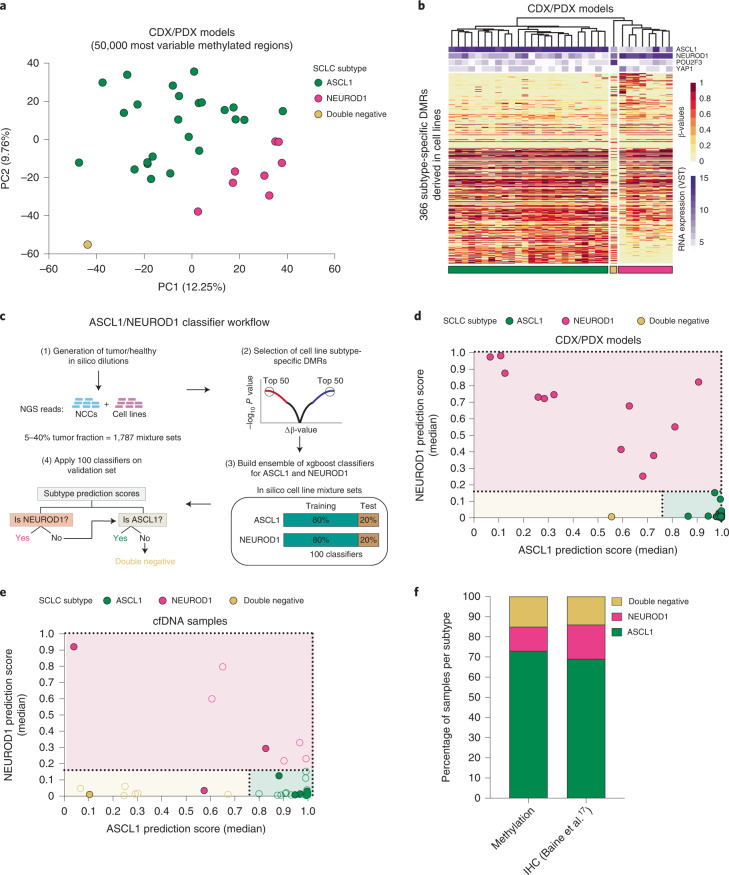
Fig. 5. DNA methylation profiling identifies SCLC subtypes in both preclinical models and cfDNA samples.
a, PCA plot of 33 CDX/PDX models (not including second models derived from the same patient), using β-values for the 50,000 most variable methylated regions across these models. CDX and PDX models segregated according to the expression of ASCL1, NEUROD1 (single or coexpressing with ASCL1) and POU2F3 (double negative) b, Hierarchical clustering heat map of β-values for 33 CDX/PDX models using 366 subtype-specific DMRs derived from publicly available DNA methylation data for 59 cell lines. Bars on the top show the expression values (variance-stabilizing transformation; VST) of ASCL1, NEUROD1, POU2F3 and YAP1 derived from RNA-seq data for each model. c, Analysis workflow for the generation of ASCL1 and NEUROD1 classifiers. d,e, ASCL1 and NEUROD1 classifier median prediction scores for 33 CDX/PDX models (d) and 56 cfDNA samples with an estimated tumor fraction of at least 4% (e). Color fill of dots indicates known subtype. In e, only cfDNA samples from patients who also generated a CDX model (n = 11) have known subtype. Dotted lines indicate classifier cutoff values. f, Bar plots of subtype distribution detected by cfDNA methylation (n = 56 patients) compared to subtype distribution detected by immunohistochemistry (IHC) of SCLC tissue samples (n = 159) from a previous study17. In a,b,d data for each CDX model are averaged over tumors from up to three independent mice.

