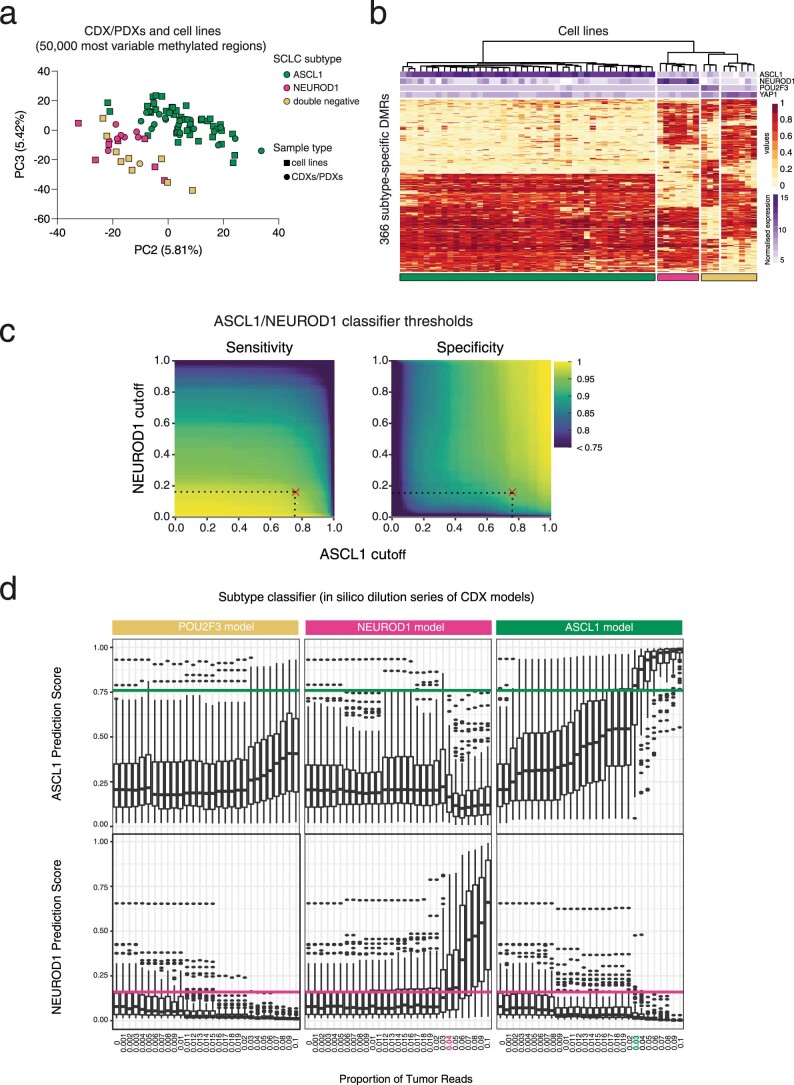
Extended Data Fig. 4. Identification of SCLC subtype-specific DMRs.
a, PCA plot showing the 59 SCLC cell lines (43 ASCL1, 7 NEUROD1, 9 dual negative) and 33 CDX/PDX models (24 ASCL1, 8 NEUROD1, 1 dual negative; second models derived from the same patient were excluded), from PCA applied to β-values for the 50,000 most variable methylated regions according to the cell lines. β-values for each CDX model were averaged over up to three independent mice. b, Hierarchical clustering heatmap showing 366 subtype-specific DMRs derived by publicly available DNA methylation data from 59 cell lines. Bars on the top show the normalized expression values of ASCL1, NEUROD1, POU2F3 and YAP1 derived from Affymetrix Exon Microarrays for each cell line. c, Heatmaps showing sensitivity and specificity for varying cutoff values applied to the median prediction scores output by applying the ASCL1 and NEUROD1 classifiers to mixture sets in held-out test data (total of n = 1,787 mixture sets). Red crosses indicate the cutoffs (0.16 for NEUROD1; 0.76 for ASCL1) that jointly optimize the balanced accuracy metric (average of sensitivity and specificity) across both classifiers. d, Box plots of classifier prediction scores for n = 100 individual ASCL1 classifiers (top) or n = 100 individual NEUROD1 classifiers (bottom), applied to in silico serial dilutions of a POU2F3 (left), NEUROD1 (middle) or ASCL1 (right) CDX model mixed with an NCC cfDNA sample, with varying proportions of the CDX model in the mixture (x-axis). Boxes mark the 25th percentile (bottom), median (central bar) and 75th percentile (top). Whiskers extend to the most extreme value within 1.5-fold of interquartile range. Points lying outside the whiskers are plotted individually. Horizontal lines show the cutoffs for ASCL1 and NEUROD1 classifiers derived above.

