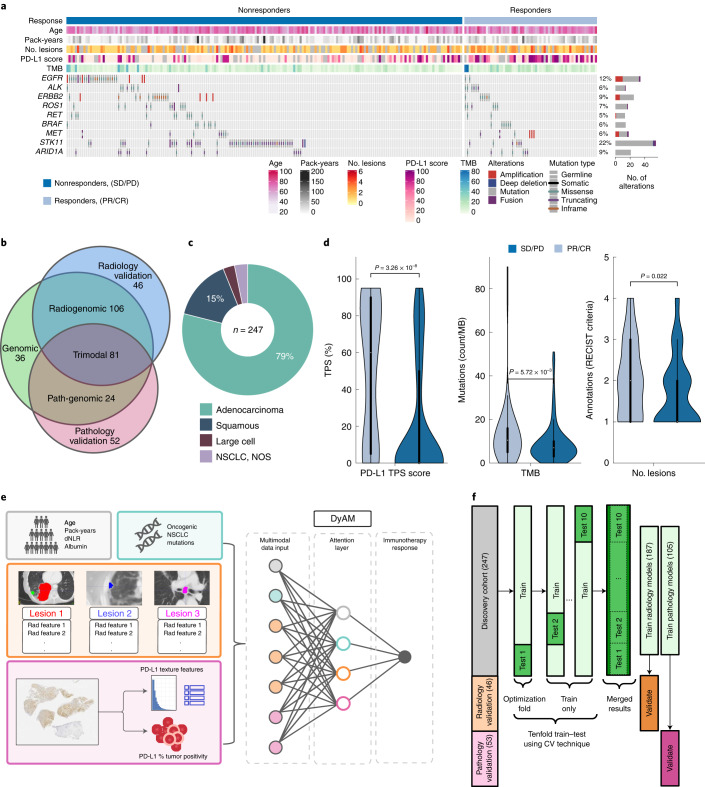
Fig. 1. Multimodal cohort characteristics and schema outlining the project.
a, Multimodal cohort heat map listing clinical, pathological, radiomic and genomic characteristics for n = 247 patients. The stacked bar plot shows the number of patients with a genomic alteration, where the colors correspond to alteration types. b, Cohort modality overview Venn diagram, with the number of patients exclusively in each category. c, Lung cancer histology breakdown. d, Distribution of PD-L1 TPS (n = 201 patients), TMB (n = 247 patients) and number of annotated lesions (n = 187 patients) between responders (PR/CR) and nonresponders (SD/PD). The interior box-and-whisker bars show the mean as a white dot, the IQR (25–75%) as a black bar and the minimum and maximum as whiskers up to 1.5 × IQR. P values were obtained from a two-sided Mann–Whitney–Wilcoxon test. e, Analysis overview using DyAM to integrate multiple modalities to predict immunotherapy response. f, Train–test–validate, breakdown and optimization scheme. CV, cross-validation.

