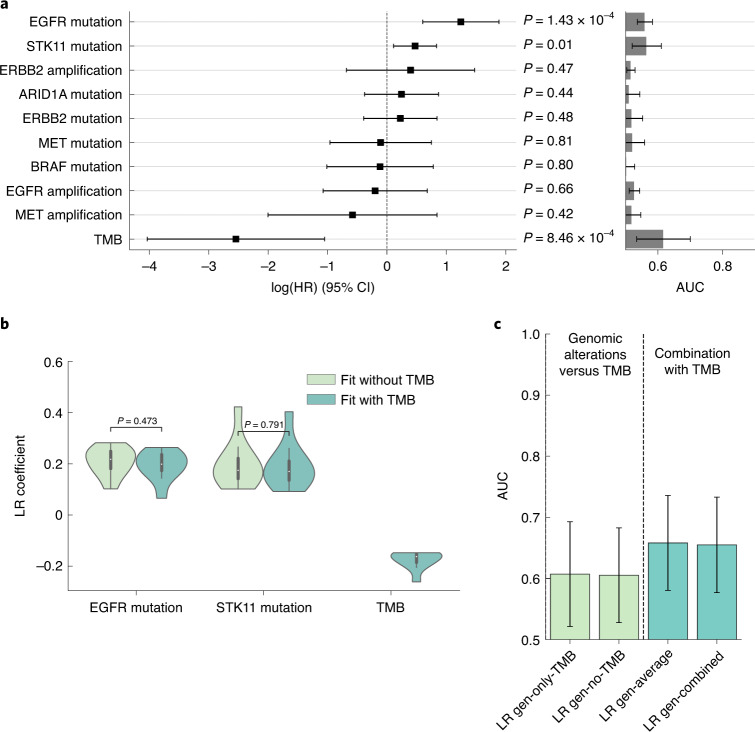
Fig. 4. Modeling of response from genomic alterations and TMB.
a, aHRs using Cox proportional hazard model analysis of genomic variables alongside single feature AUCs. P values were obtained from the likelihood-ratio test for n = 247 patients. b, Comparison of EGFR and STK11 feature coefficients with and without the inclusion of TMB in the model for n = 10 fits. The interior box-and-whisker bars show the mean as a white dot, the IQR (25–75%) as a black bar and the minimum and maximum as whiskers up to 1.5 × IQR. c, AUCs resulting from models using only TMB, genomic alterations (without TMB), averaging predictions from the TMB and alterations models and fitting a model with both TMB and genomic alterations. The bar height and error bar represent the AUC and associated 95% CI based on DeLong’s method51 for n = 247 patients with genomic data.

