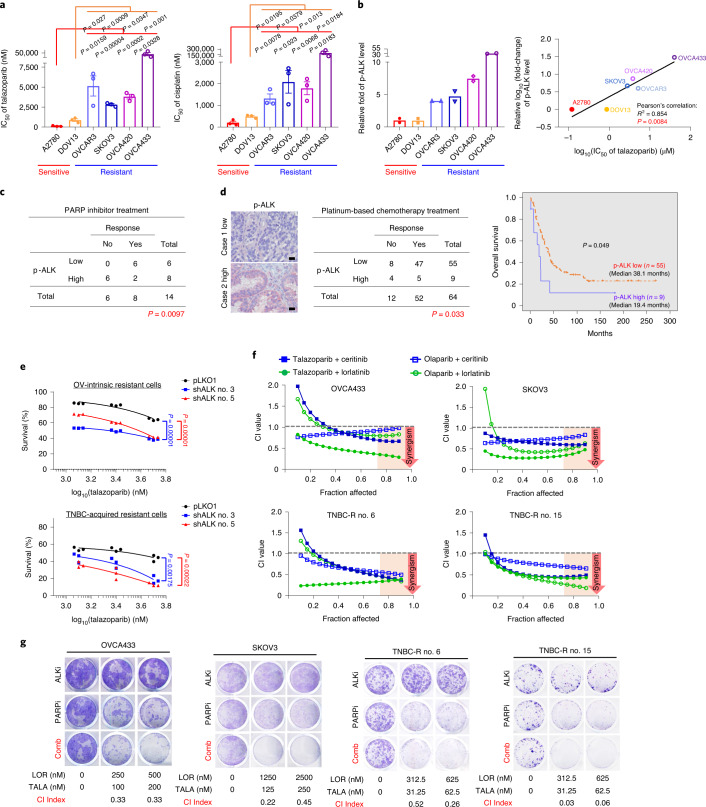
Fig. 1. ALK inhibition demonstrates synergistic effects with PARP inhibitors in vitro.
a, IC50 of the PARP inhibitor, talazoparib (left panel) and cisplatin (right panel). Ovarian cancer cells were treated with talazoparib or cisplatin for 6 d and subjected to MTT assay to determine cell viability. Error bars represent mean ± s.e.m. of n = 3 independent experiments, two-tailed, unpaired Student’s t-test. b, Left: quantification of phosphorylation signals of ALK in PARP inhibitor-sensitive and PARP inhibitor-resistant ovarian cancer cells. Cell lysates were analyzed using the Human Phospho-RTK Array Kit following the manufacturer’s instructions. Quantified phosphorylation signal was derived from two antibody spots of ALK. Right: correlations between IC50 of PARP inhibitor (talazoparib) and phosphorylation signals of ALK in PARP inhibitor-/platinum-sensitive and PARP inhibitor-/platinum-resistant ovarian cancer cells (Pearson’s correlation coefficient; P = 0.0084). Independent experiments (n = 3) of MTT assay for calculating the IC50 of PARP inhibitors. c, Correlation between clinical responses to PARP inhibitor (olaparib) and expression of p-ALK (high p-ALK (n = 8 patients) versus low p-ALK (n = 6 patients) in patients with ovarian cancer (two-sided Fisher’s exact test; P = 0.0097). d, Left: representative images and correlation between clinical responses to cisplatin/carboplatin and expression of p-ALK (high p-ALK (n = 9 patients) versus low p-ALK (n = 55 patients) in patients with ovarian cancer (two-sided Fisher’s exact test; P = 0.033). Scale bar, 20 µm. Right: Kaplan–Meier overall survival curves of patients with ovarian cancer, stratified by p-ALK expression levels (high p-ALK (n = 9 patients) versus low p-ALK (n = 55 patients; P = 0.049). e, Cell viability of ALK-knockdown PARP inhibitor-resistant cells treated with the indicated concentration of talazoparib for 6 d. Cell survival is calculated as the percentage relative to the control treatment in each group. OV, ovarian. Data represent n = 3 independent experiments, two-tailed, unpaired Student’s t-test. f, Chou–Talalay analysis of PARP inhibitor-resistant ovarian or TNBC cells treated with varying concentrations of PARP inhibitors (talazoparib or olaparib) and ALK inhibitors (ceritinib or lorlatinib) for 6 d. Synergism showed as CI < 1 at an optimal effect level (Fa > 0.75). The mean percentage of growth inhibition derived from n = 3 independent experiments of the MTT assay was used to calculate the CI value. g, Representative images of clonogenic assay results in PARP inhibitor (PARPi)-resistant ovarian and TNBC cells in the presence of the indicated inhibitor for 12 d. ALKi, ALK inhibitor; LOR, lorlatinib; TALA, talazoparib; Comb, combination of lorlatinib and talazoparib. The mean percentage of growth inhibition derived from n = 3 independent experiments of the clonogenic assay was used to calculate the CI value. Synergistic inhibition of cell proliferation is defined as CI < 1.

