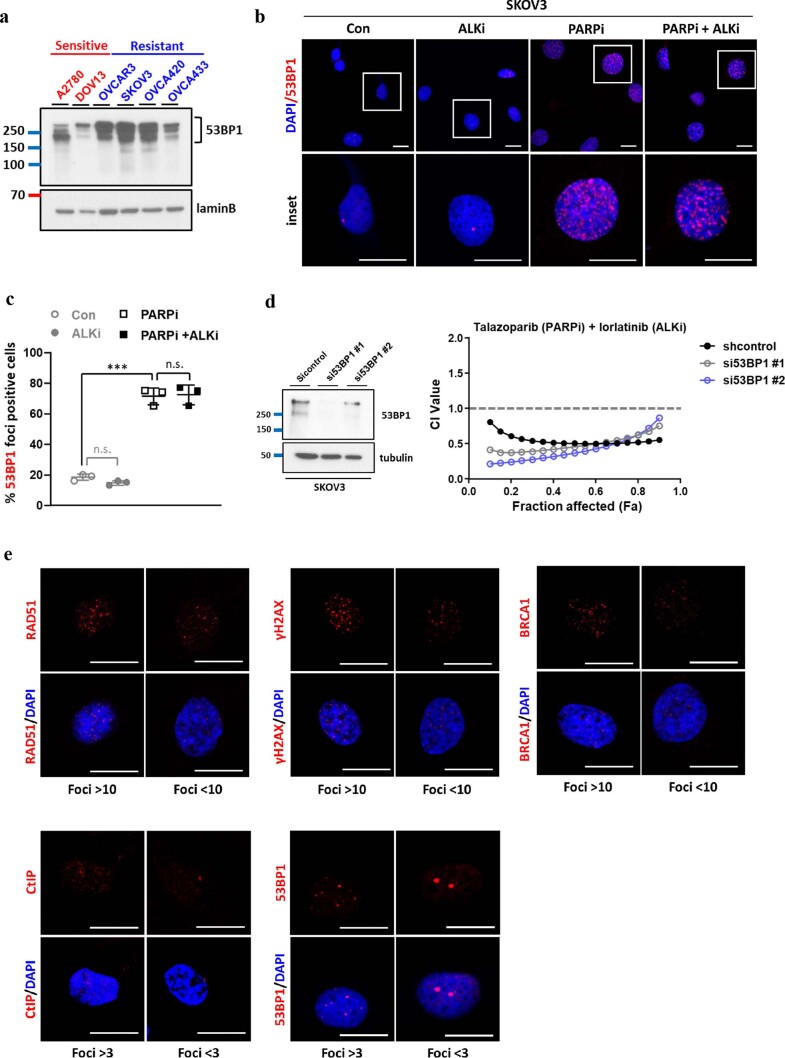
Extended Data Fig. 4. Relationship between 53BP1-dependent NHEJ and ALKi-mediated sensitization to the PARP inhibition.
(a) Western blot analysis of 53BP1 expression in PARPi-sensitive and PARPi-resistant ovarian cancer cells. Data are representative of two repeats with similar results. (b, c) Representative images of 53BP1 with DAPI staining (b) and quantification of 53BP1 foci–positive cells (c) in PARPi-resistant ovarian cancer cells treated with 0.25 μM PARPi (talazoparib) or 0.5 μM ALKi (lorlatinib), either alone or in combination, for 48 hours. Error bars represent mean ± SD of N = 3 independent experiments. Insets, 3× magnification. Bar, 20 µm. n.s., not significant, Control (Con, ○) vs PARP inhibitor (PARPi,■): ***P = 0.00009, two-tailed unpaired t test. (d) PARPi-resistant SKOV3 cells were transfected with control siRNA (siControl or siRNAs targeting 53BP1 (si53BP1#1, si53BP1#2)). Relative expression levels of total 53BP1 in cells were determined by Western blot analysis (left panel). Chou-Talalay analysis of PARPi-resistant, knockdown control, or 53BP1-depleted cells treated with varying concentrations of PARPi (talazoparib) and ALKi (lorlatinib) for 6 days (right panel). The mean percentage of growth inhibition derived from N = 3 independent MTT experiments was used to calculate the combination index (CI) value. Synergistic inhibition of cell proliferation is defined as CI < 1. (e) Representative images of cells that are just above and below positivity thresholds for each marker as indicated. Bar, 20 µm. Data are representative of N = 3 independent experiments with similar results.

