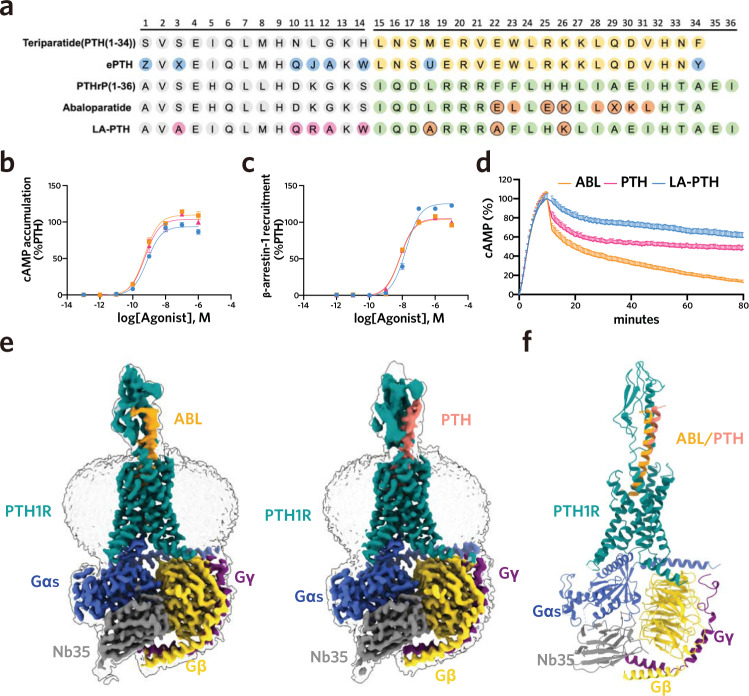
Fig. 1. Cryo-EM structures of PTH– and ABL–bound PTH1R–Gs complexes.
a Sequence alignment of the ligands assessed in this study. Relative to PTH, the amino acid substitutions of ePTH are colored blue and the “M” substitutions of LA-PTH are colored pink. Relative to PTHrP, the C-terminal substituted residues of LA-PTH and ABL are colored orange. Amino acids are indicated in one-letter code, Z indicates Ac5c (aminocyclopentane-1carboxylic acid); X indicates Aib (α-methylalanine); J indicates Hrg (homoarginine); U indicates Nle (norleucine). b, d Dose-response curves shows the signaling profiles in cAMP accumulation (b), β-arrestin1 recruitment (c), and duration of ligand-induced cAMP signaling responses (d). e, f Cryo-EM density maps and cartoon representation of the PTH1R–Gs complexes. PTH, salmon; ABL, orange; PTH1R, dark cyan; Gαs, royal blue; Gβ, yellow; Gγ, purple; Nb35, grey. Source data are provided as a Source Data file.

