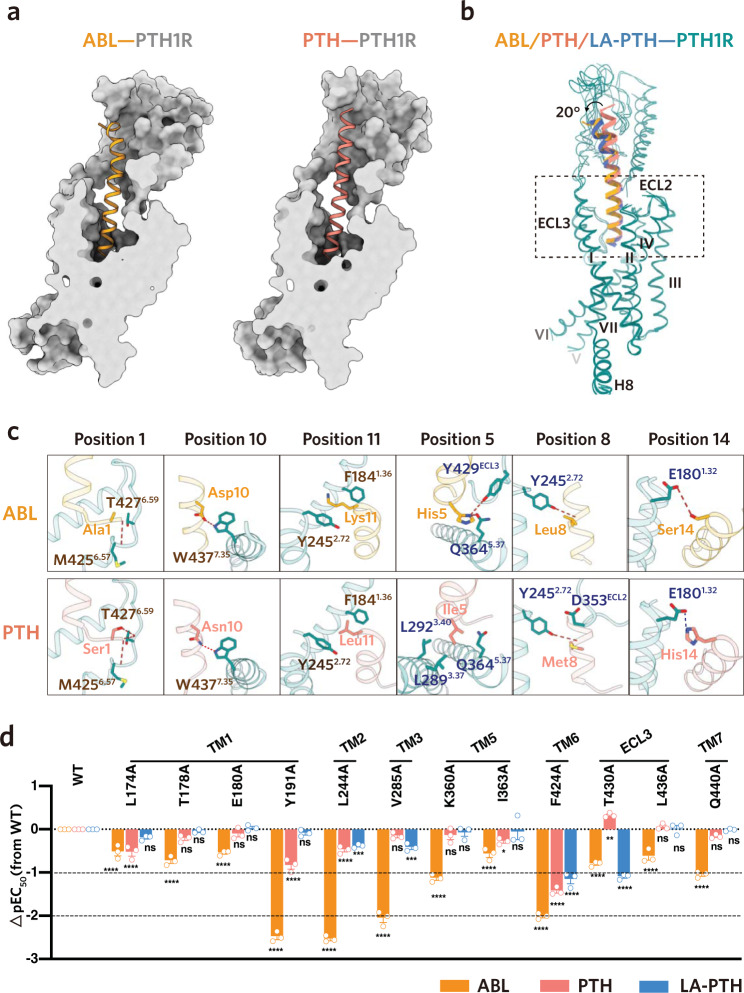
Fig. 3. Interactions of PTH and ABL with PTH1R.
a Vertical cross-section of PTH– and ABL–binding pocket in PTH1R. b Structural comparisons of the ligand-binding modes between PTH, ABL and LA-PTH. c Detailed interactions of PTH1R with the distinct residues in the N-terminal portion of PTH and ABL. Similar interactions are colored in brown (positions 1, 10 and 11), and the differential interactions are colored in blue (positions 5, 8 and 14). Hydrogen bonds and salt bridge are depicted as red and blue dashed lines, respectively. d The ABL–, PTH– and LA-PTH–induced cAMP accumulation assays of the PTH1R variants harboring mutations of the residues involved in the differential recognition of three peptide agonists. Bars represent differences in calculated different peptide agonists potency [pEC50] for each mutant relative to the wild-type receptor (WT). Data are colored according to the extent of the different peptide agonists. nsP > 0.01, *P < 0.05, **P < 0.01, ***P < 0.001 and ****P < 0.0001. All data were analyzed by one-way analysis of variance (ANOVA) followed by Dunnett’s multiple comparison test, compared with the response of WT (P < 0.001, P < 0.001, P = 0.2164, P < 0.001, P = 0.1552, P = 0.9991, P < 0.001, P = 0.8638, P = 0.9996, P < 0.001, P < 0.001, P = 0.9481, P < 0.001, P < 0.001, P = 0.0006, P < 0.001, P = 0.4907, P = 0.0002,P < 0.001, P = 0.5859, P = 0.9795, P < 0.001, P = 0.0259, P = 0.9991, P < 0.001, P < 0.001, P < 0.001, P < 0.001, P = 0.0058, P < 0.001, P < 0.001, P = 0.999, P = 0.9998, P < 0.001, P = 0.4148 and P = 0.9998 from left to right). Data represent the mean ± SEM from n = 3 biologically independent experiments performed in triplicate. See also Supplementary Figs. 6 and 7. Source data are provided as a Source Data file.

