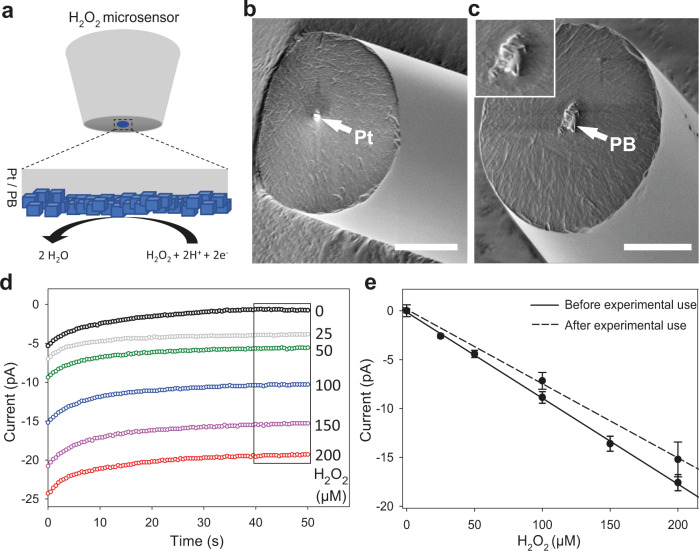
Fig. 3. Characterization of H2O2 microsensors.
a Schematic principle of Prussian blue based H2O2 microsensor. b, c are scanning electron microscope images of a Pt ultramicroelectrode and the Prussian blue modified Pt ultramicroelectrode. Scale bars, 10 µm (b); 10 µm (c). d Amperometric response of a H2O2 microsensor to 0 µM (black,), 25 µM (gray), 50 µM (green), 100 µM (blue), 150 µM (magenta) and 200 µM (red) H2O2. e Calibration plots of the H2O2 microsensors before (solid line) and after 4-h experimental use (dashed line). The currents were extracted from the mean values between 40 s and 50 s of the measurements. Data in e are shown as means values, and error bars show SD (n = 3, independent experiments).

