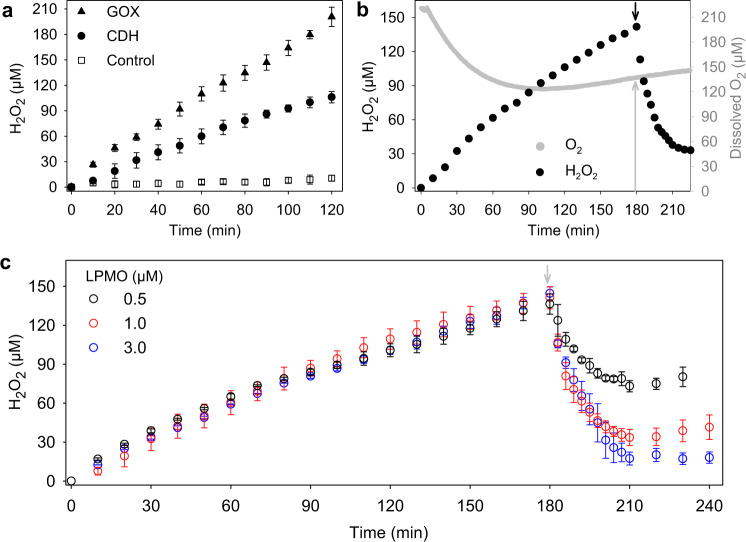
Fig. 4. Detection of local H2O2 formation and consumption in the vicinity of wood cell walls.
a The graph shows time courses of H2O2 formation by 2 mg mL−1 cellobiohydrolases and 1 µM C. hotsonii CDH variant (filled circles) or 2 mg mL−1 cellobiohydrolases and 1 mg mL−1 β-glucosidase in combination with 1 µM GOX (filled triangles) during hydrolysis of poplar wood cell walls in the absence of LPMO. In the control experiment (empty squares), only 2 mg mL−1 cellobiohydrolase has been applied. b The change of O2 (gray circles) and H2O2 concentration (black circle) in the vicinity of wood cell walls before and after LPMO catalysis. The additions of 1 µM LPMO9C and 1.0 µM N. crassa CDHIIA are indicated by a black arrow. c Time courses of H2O2 consumption by 0.5 µM (black circle), 1.0 µM (red circle), and 3.0 µM (blue circle) LPMO9C in combination with 1.0 µM N. crassa CDH. Their additions after 180 min are indicated by a gray arrow. In the experiments shown in b, c, 2 mg mL−1 cellobiohydrolases and 1 µM C. hotsonii CDH variant are applied since the beginning to produce H2O2. All experiments were conducted in a 50 mM sodium acetate buffer, pH 5.5 at ∼20 °C. The reference experiment without addition of LPMO is given in Fig. 5a (black circles). Data in a are shown as means values, and error bars show SD (n = 3, independent experiments). Data in c are shown as means values, and error bars show SD (n = 2, independent experiments).

