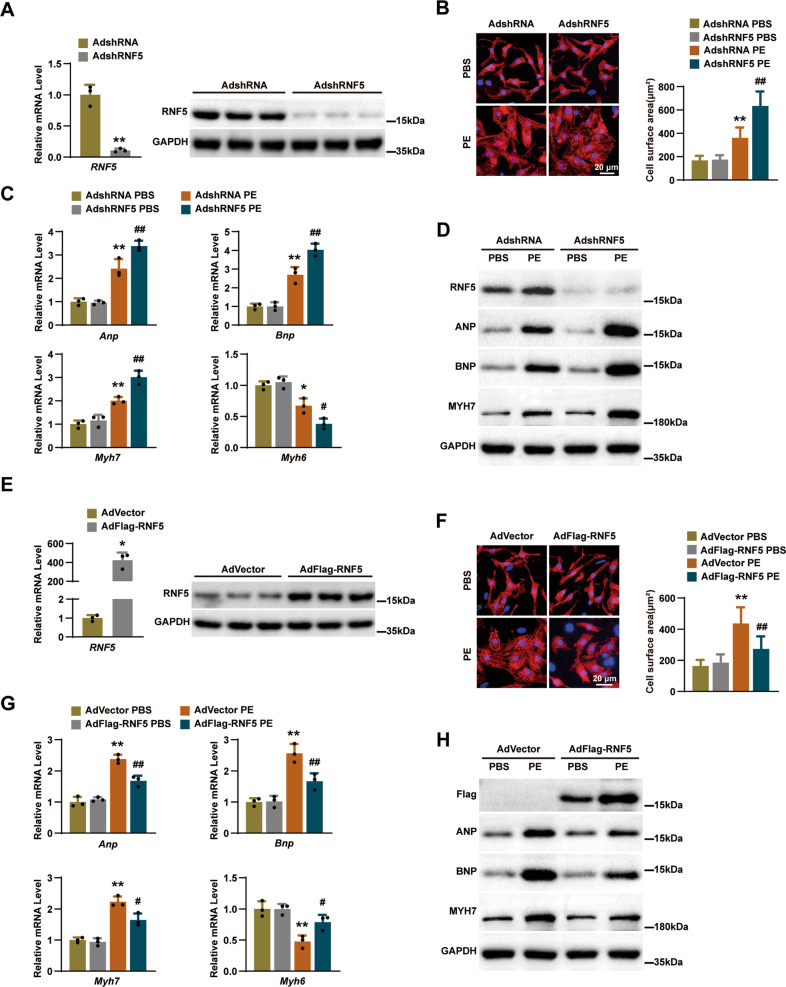
Fig. 4. RNF5 deficiency aggravates cardiomyocyte hypertrophy in vitro.
A NRCMs were infected with AdshRNA or AdshRNF5 for 24 h, and the expression of RNF5 in cell lysates was analyzed by RT-PCR and WB. B NRCMs were infected with AdshRNA or AdshRNF5, and then NRCMs were treated with PBS or PE for 24 h. Cardiomyocytes were identified by α-actinin staining (red), and nuclei were stained with DAPI (blue). Scale bars: 20 μm. Statistical results for the cell surface area of cardiomyocytes in different groups (n = 40 cells per group). C RT-PCR analysis of the mRNA levels of ANP, BNP, MYH7, and MYH6 in NRCMs infected with AdshRNA or AdshRNF5 after 24 h treatment with PBS or PE. D WB analysis of RNF5, ANP, BNP, and MYH7 in NRCMs infected with AdshRNA or AdshRNF5 after 24 h treatment with PBS or PE. E–H NRCMs were infected with AdVector or AdFlag-RNF5 for 24 h; other experimental methods and conditions were described in A–D. For (A, E) *P < 0.05 versus AdVector, **P < 0.01 versus AdshRNA. Data were presented as the mean ± SD. Statistical analysis was carried out by Student’s two-tailed t-test. For (B, C) *P < 0.05 or **P < 0.01 versus AdshRNA PBS, #P < 0.05 or ##P < 0.01 versus AdshRNA PE. Data were presented as the mean ± SD. Statistical analysis was carried out by one-way ANOVA. For (F, G) *P < 0.05 or **P < 0.01 versus AdVector PBS, #P < 0.05 or ##P < 0.01 versus AdVector PE. Data were presented as the mean ± SD. Statistical analysis was carried out by one-way ANOVA.

