Figure 4.
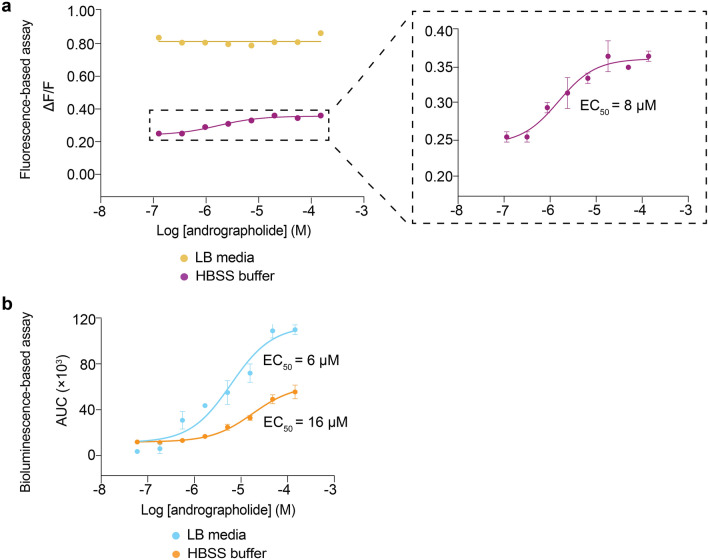
Dose–response curve of TAS2R50 in response to andrographolide stimulation when dissolved in different media. (a) Andrographolide dissolved in LB medium produced uniformly high fluorescence signals. When andrographolide was dissolved in HBSS buffer, a clear dose–response curve could be discerned, with an inset showing an enlarged view of the functional response curve. (b) Concentration–response curve of TAS2R50 upon stimulation by andrographolide dissolved in LB and HBSS buffer obtained from the bioluminescence-based assay. Data points are shown as mean ± s.e.m. from a representative experiment out of at least two independent biological replicates performed in technical quadruplicates. EC50, half-maximal effective concentration.

