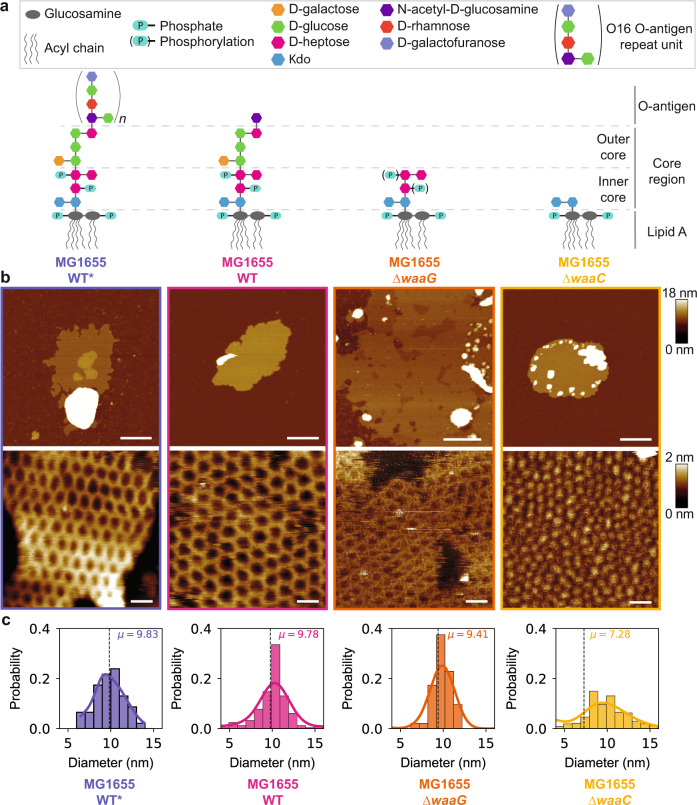
Fig. 2. Structural parameters of crystalline structures respond directly to chemical alterations of the LPS molecule.
a Schematic chemical structure of the LPS molecules in four different E. coli strains, MG1655 WT*, WT, ∆waaG, and ∆waaC. b Overview (top) and high-resolution (bottom) AFM topographs of OM patches from each E. coli strain, after incubation with polymyxin E. Scale bars, 200 nm (top panel) and 20 nm (bottom panel). c Histograms of the lattice constants of the two-dimensional crystalline structures and the mean ± standard deviation (SD) for analyzed structures (n): aWT*=9.8 ± 1.7 nm (n = 46), aWT = 9.8 ± 3.9 nm (n = 244), aΔwaaG = 9.4 ± 2.7 nm (n = 144), aΔwaaC = 7.3 ± 3.7 nm (n = 367). Source data are provided as a Source Data file.

