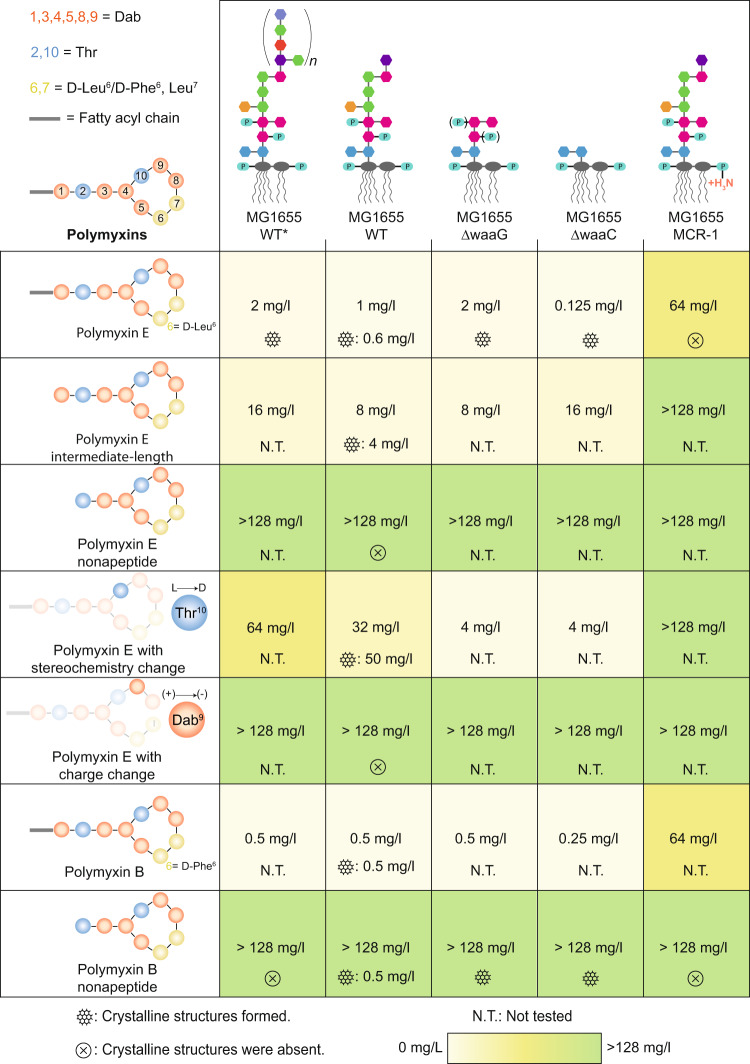
Fig. 4. Minimal inhibitory concentrations (MICs) and crystalline structure formation propensity of polymyxin variants on different E. coli MG1655 strains.
Each cell reports the MIC values as determined by an automated multi-well growth assay and the propensity of crystalline structure formation, along with the polymyxin concentrations that resulted in the formation of the crystalline structures. Cells are colored according to their MIC to guide the eye.

