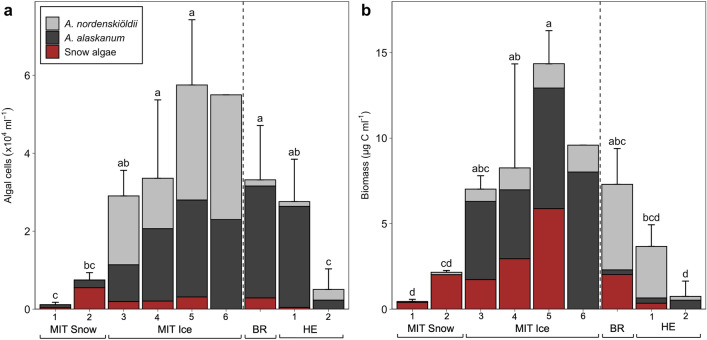
Figure 2.
Algal abundance (a) and biomass (b) displayed as averages per sampling site (MIT = Mittivakkat, BR = Bruckner Glacier, HE = Heim Glacier). Coloured bars indicate the algal group contributions to overall total abundance and biomass with corresponding standard deviation bars on top. Colours indicate relative contributions by glacier ice algae (A. nordenskiöldii and A. alaskanum) and red snow algae (Chlamydomonadales sp.). Unequal lowercase letters indicate significant differences between sites.

