Figure 5.

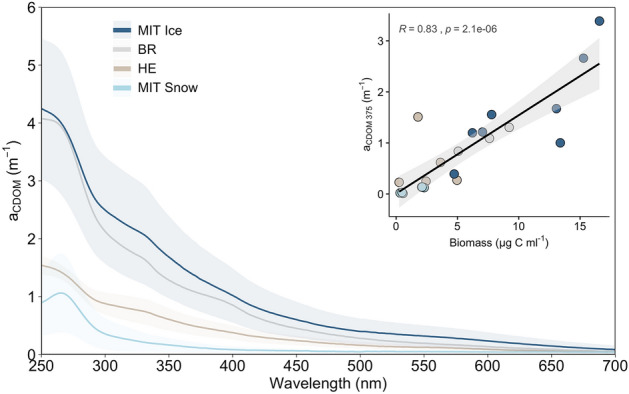
Chromophoric dissolved organic matter (CDOM) spectral absorption among regions. Insert shows the correlation of aCDOM 375 with total algal biomass. Grey area indicates the 95% CI and R the Spearman correlation coefficient.

Chromophoric dissolved organic matter (CDOM) spectral absorption among regions. Insert shows the correlation of aCDOM 375 with total algal biomass. Grey area indicates the 95% CI and R the Spearman correlation coefficient.