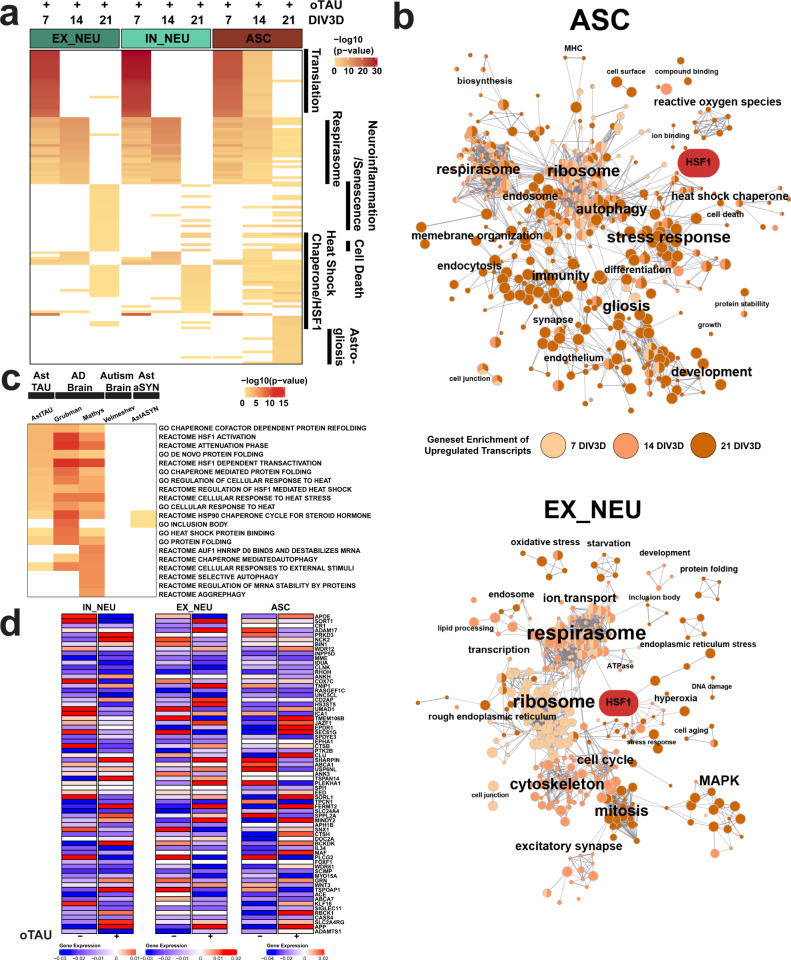
Fig. 5. Functional gene set enrichment of scRNA-seq DEGs reveals oTau-induced pathway perturbations in AstTau.
a Top 25 functional gene set enrichment pathways by P value of significant upregulated DEGs (see “Methods”, P < 0.05, log2foldchange > 0.25) between AstTau and control for each timepoint in EX_NEU, IN_NEU, and ASC cell populations presented as –log10 P value highlighting trends of cell-type-specific pathway perturbations across the 7–21 DIV3D time course. Manual annotation of shared gene set features presented for clarity. See Supplementary Fig. 10 for full annotations. b EnrichmentMap clustering presentation of functional gene set enrichment results (see “Methods”, P < 0.05) with manual annotations across the 7 (light orange), 14 (orange), and 21 DIV3D (dark orange) time course for significantly upregulated DEGs in EX_NEU and ASC, identifying a wide range of cell-type-specific upregulated responses in AstTau. An HSF1-associated cluster is highlighted in red. c Top ten functional gene set enrichment pathways from the 21 DIV3D AstTau model and two published AD snRNA-seq datasets (refs. 72 and 74) presented as −log10 P value alongside functional gene set enrichment results from a published autism snRNA-seq dataset (ref. 116) and the 21 DIV3D AstαSYN model highlighting the enrichment similarity between AstTau and AD brain transcriptomes and the disparity between AstTau and AstαSYN and ASD brain transcriptomes (see “Methods”). Source data are provided as a Source Data file. d Scaled gene expression of AD GWAS genes124 in IN_NEU, EX_NEU, and ASC at 21 DIV3D control (oTau−) and AstTau (oTau+) conditions.

