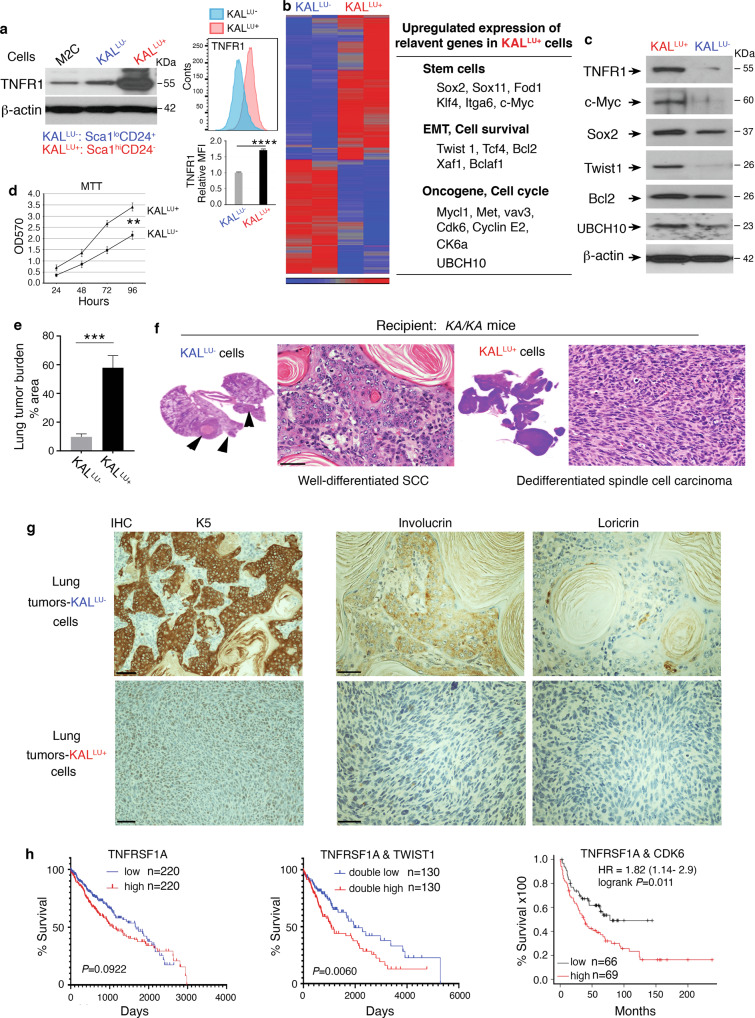
Fig. 2. High-TNFR1 levels are associated with dedifferentiated lung spindle cell carcinoma.
a Left: TNFR1 protein levels detected by immunoblotting in M2C, KALLU- (ScalloCD24+CD44+) and KALLU+ (ScalhiCD24-CD44+) cells. lo, low; hi, high; β-actin, a protein-loading control. Right: Flow cytometry analyzes TNFR1 expression levels (MFI, Mean Fluorescence Intensity) in KALLU- and KALLU+ cells (high panel, images; low panel, statistical analysis for MFI of TNFR1 staining). Mean ± SD (three repeats) ****P < 0.0001; Student’s t-test. b Left: Heatmap comparing the gene expression profiles of KALLU- and KALLU+ cells by gene array analyses. Right: Some upregulated genes in KALLU+ cells compared to KALLU- cells. c Immunoblotting analysis verifying the expression of listed genes from Fig. 2b in KALLU- and KALLU+ cells. β-actin, a protein-loading control. d Comparison of KALLU- and KALLU+ cell proliferation using the MTT assay. Mean ± SEM (three repeats). **P < 0.01; Student’s t-test. e Tumor burden in the lungs generated by KALLU- and KALLU+ cells in KA/KA mice (n = 5/group). Mean ± SD; ***P < 0.001; Student’s t-test. f Representative images of a well-differentiated lung SCC generated by KALLU- cells and spindle cell carcinoma generated by KALLU+ cells in the lungs of KA/KA mice with the histological morphology stained with hematoxylin and eosin (H&E). Scale bar: 50 μM. g IHC staining of SCCs obtained from tail-vein injected KALLU- and KALLU+ cells with anti-K5, anti-involucrin, and anti-loricrin antibodies. Scale bar: 40 μM. h Survival curves of patients with lung SCCs expressing high TNFRSF1A or low TNFRSF1A levels (left), double-high TNFRSF1A and TWIST1 or double-low TNFRSF1A and TWIST1 levels (middle); and double-high TNFRSF1A and CDK6 or low TNFRSF1A levels (right). These data were obtained from OncoLnc.

