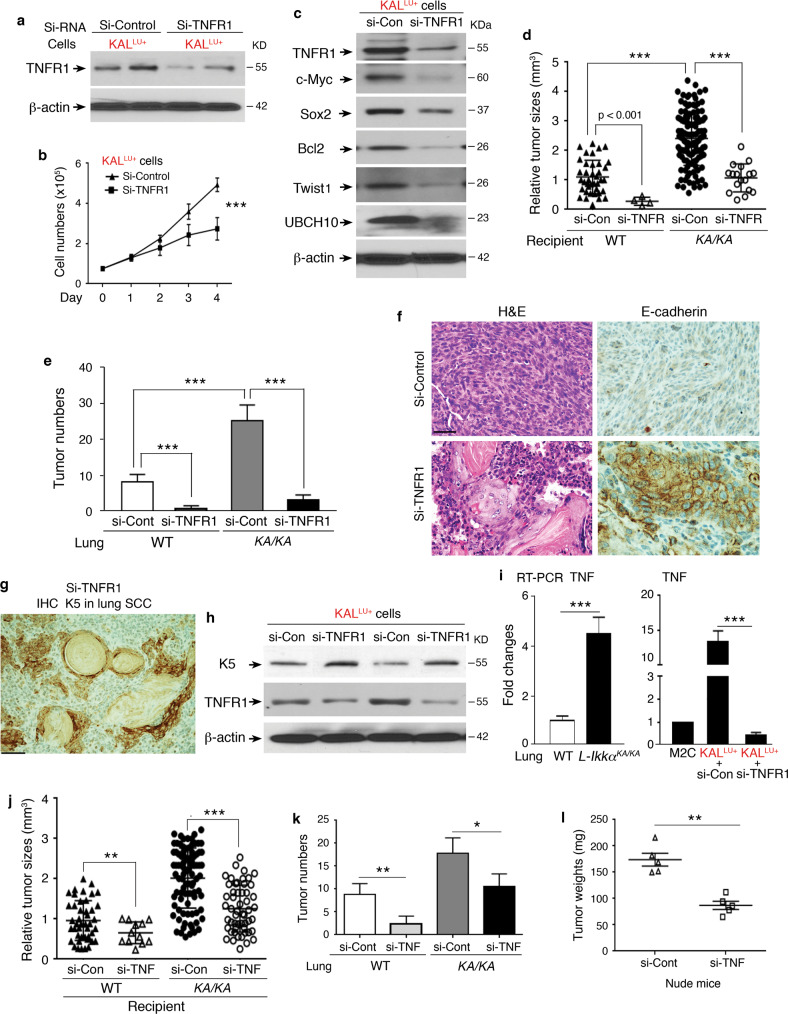
Fig. 3. Silencing TNFR1 expression reverses dedifferentiated spindle cell carcinoma to well-differentiated SCC.
a Immunoblotting analysis showing TNFR1 levels in KALLU+ cells treated with TNFR1 siRNA (si-TNFR1) or si-Control. β-actin, a protein-loading control. b Growth curve of KALLU+ cells treated with si-TNFR1 or si-Control. Mean ± SD (three repeats); ***P < 0.001; Two-way AVOVA statistical test. c Immunoblotting analysis shows indicated protein levels in KALLU+ cells treated with si-Control (si-Con) or si-TNFR1. β-actin, a protein-loading control. d, e Comparing tumor sizes (d) and numbers (e) derived from KALLU+ cells treated with si-Control (si-Con) or si-TNFR1 in WT and KA/KA mice (recipient, n = 5/group). Each symbol represents a tumor. Mean ± SD; ***P < 0.001; Student’s t-test. f H&E-stained and E-cadherin IHC-stained sections of tumors derived from KALLU+ cells treated with si-Control or si-TNFR1 in KA/KA mice (recipient). Scale bar: 40 μM. g K5 IHC staining for lung SCCs derived from si-TNFR1 KALLU+ cells in KA/KA mice at 1.5 months after cell injections. Scale bar: 50 μM. h Immunoblotting analysis showing the levels of K5 and TNFR1 in KALLU+ cells treated with si-Control and si-TNFR1. β-actin, a protein-loading control. i RT-PCR analysis showing TNF expression in WT and L-KA/KA lungs (left) and in M2C and KALLU+ cells (right) treated with si-Control (si-Con) and si-TNFR1 (n = 3/group). Mean ± SD (three repeats per group); ***P < 0.001; Student’s t-test. j, k Comparing tumor sizes (j) and tumor numbers (k) derived from KALLU+ cells treated with si-Control (si-Con) or si-TNF in WT and KA/KA mice (n = 5/group). Mean ± SD; *P < 0.05; **P < 0.01; ***P < 0.001; Student’s t-test. l Weights of tumors isolated from nude mice receiving subcutaneous injections of KALLU+ cells treated with si-Control (si-Cont) and si-TNF RNA (n = 5/group). Mean ± SD; **P < 0.01; Student’s t-test.

