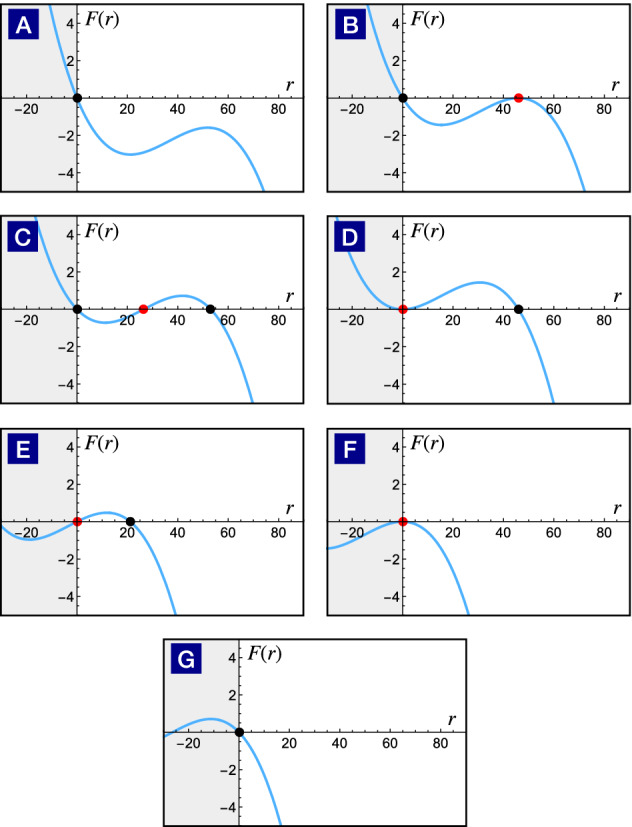
Figure 6.

Dynamical phase transitions driven by the F(r) evolution. As the fitting function s(I) changes with the external current, the cubic function slides through different configurations from (A) to (G). The black and red points indicate the radius of the stable and unstable limit cycle respectively. Configurations from (A) to (D) show the birth of a pair of limit cycles and the unstable limit cycle swallows the stable fixed point at the origin subsequently. Compared with the previous classification scheme, it belongs to the subcritical Hopf transition. Configurations from (E) to (G) illustrate the process of a stable limit cycle shrinks to an unstable fixed point, leading to a stable fixed point subsequently. This dynamical transition belongs to the supercritical Hopf transition.
