
Fig. 1.
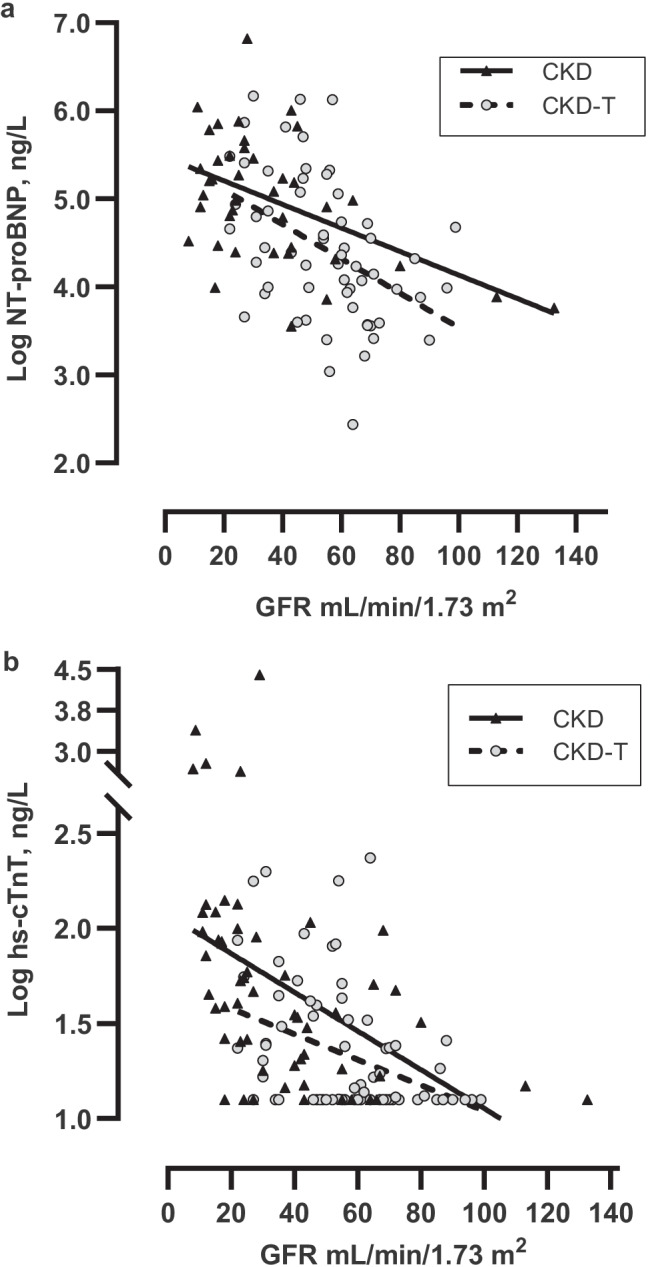
a–b Longitudinal levels of log NT-proBNP and log hs-cTnT versus GFR were analyzed using a linear regression with a cluster-robust variance–covariance matrix. Data are presented graphically for CKD patients and CKD-T patients separately. Both log NT-proBNP and log hs-cTnT were inversely associated with GFR in a linear fashion in both CKD (β = − 0.01, p < 0.001 and β = − 0.01, p = 0.001) and CKD-T patients (β = − 0.02, p = 0.004 and β = − 0.007, p = 0.009)