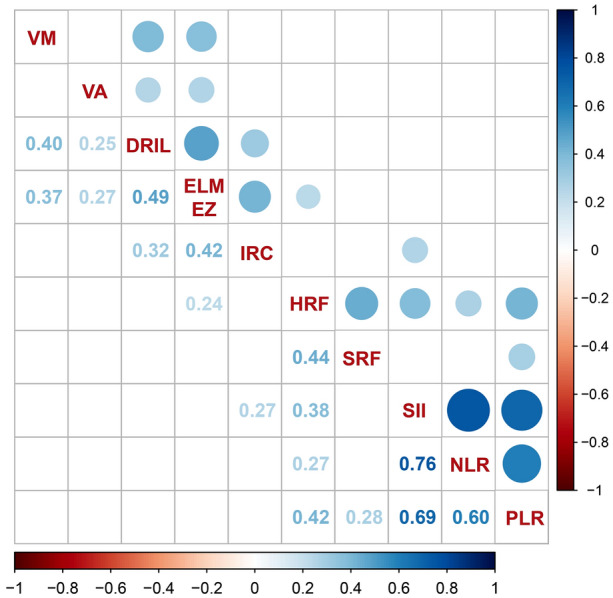
Fig. 3.

Correlation among clinical characteristics and OCT biomarkers. Color, size, and transparency of the dots in the upper half reflect the correlation tendency, degree, and significance. Only significant correlations are shown. VA visual acuity, DRIL disorganization of retinal inner layers, ELM external limiting membrane, EZ ellipsoid zone, HRF hyperreflective foci, IRC intraretinal cyst, NLR neutrophil–lymphocyte ratio, PLR platelet–lymphocyte ratio, SII systemic immune-inflammatory index, SRF subretinal fluid, VM vitreomacular status
