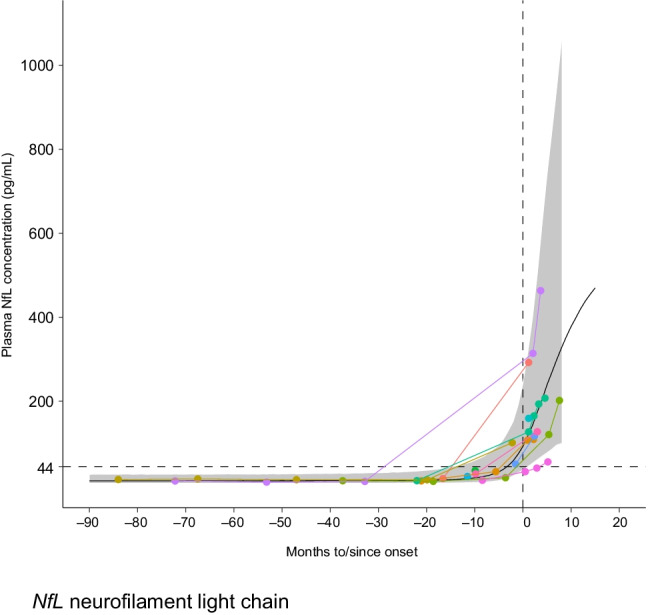
Fig. 4.

Fitted neurofilament trajectory model (using Siemens Healthineers assay results) to inform the NfL threshold in ATLAS. The black curve represents the fitted model (with 95% prediction bands for the sigmoidal fit shown in gray shading), while the colored lines represent the data. The dotted horizon line indicates the predefined threshold of 44 pg/mL. Biological samples and clinical data were from the Pre-fALS (Pre-Symptomatic Familial ALS) study
