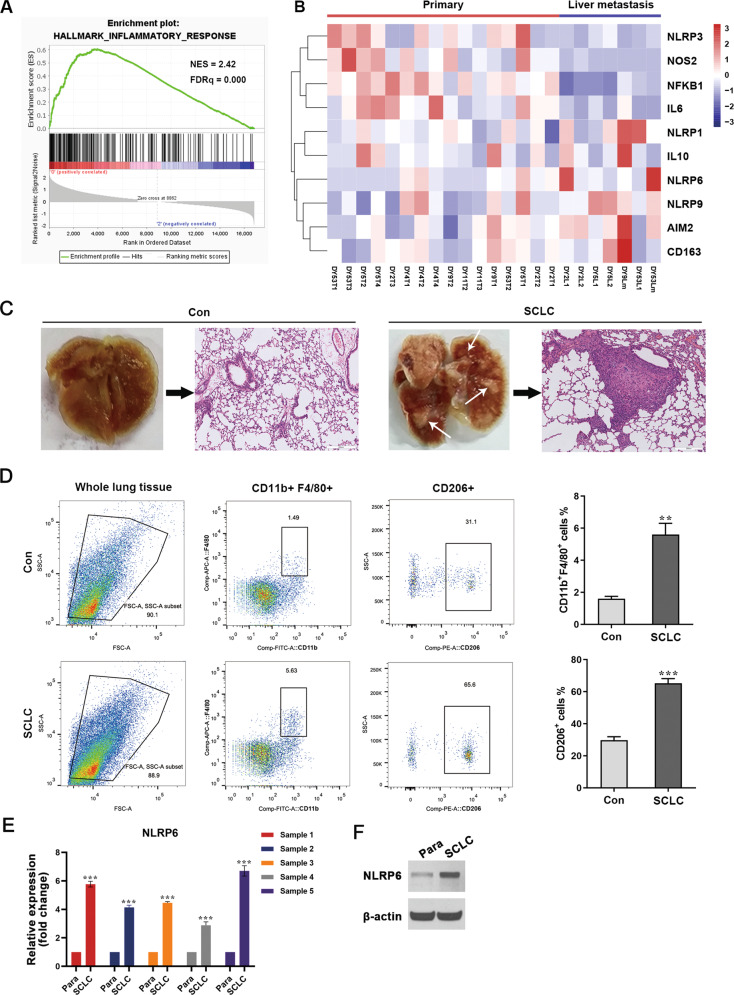
Fig. 3. M2 TAMs infiltrate into pulmonary SCLC site.
A GSEA plots showing the enrichment of the inflammatory response pathway in the primary site. B A heatmap showing expression levels of genes associated with the inflammatory response in primary tumors versus liver metastasis. C Lungs were excised from tumor-bearing mice and pulmonary SCLC tumors were isolated. Gross specimens and H&E-stained images of lungs are shown. White arrows point to the SCLC site. Con, untreated control mice. SCLC, mice injected with SCLC cells through tail vein. D Flow cytometry analysis of the polarization state of infiltrated macrophages in the lung tumor site of the SCLC nude mouse allograft model (n = 5). E qRT-PCR analysis of NLRP6 expression in lung tumor site from the SCLC nude mouse allograft model (n = 5). F Immunoblot analysis of NLRP6 expression in lung tumor site from the SCLC nude mouse allograft model (n = 5). Para, para-cancerous tissue. SCLC, SCLC cancerous tissue. Bar graphs show the mean ± SEM; **P < 0.01, ***P < 0.001. TAMs tumor-associated macrophages, SCLC small cell lung cancer, GSEA gene set enrichment analysis, H&E hematoxylin and eosin, SEM standard error of mean.

