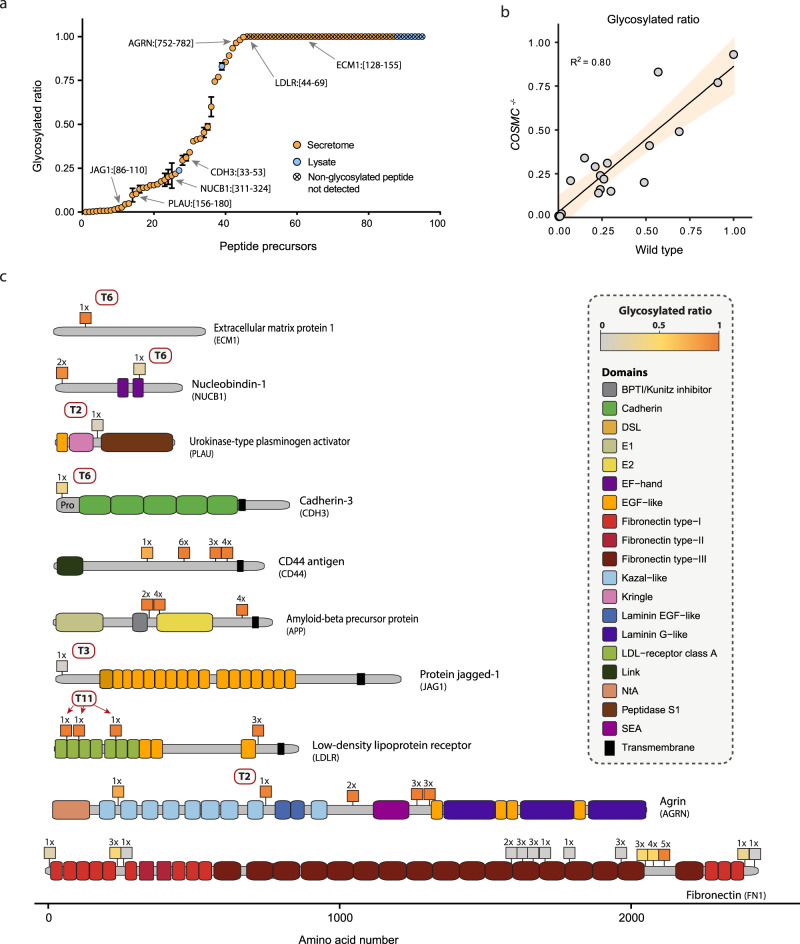
Fig. 6. O-glycosylation site occupancy on N/TERT-1 proteins.
a MS1-based relative quantification of O-glycosylation site occupancy on N/TERT-1 COSMC−/− peptides from both lysate (blue) and secreted protein (orange). Crossed data points show glycopeptides for which the non-glycosylated equivalent was not detected and the occupancy was assumed to be high. Highlighted peptides correspond to isoform-specific sites as shown in subfigure c. Source data are in Supplementary Data 5. b Comparison of occupancy data derived from single-site glycopeptides from both wild type and COSMC knockout samples. Linear correlation line plotted (R2 = 0.80) with 95% confidence region. Source data are provided as a Source Data file. c Graphical illustration of site occupancy on proteins of interest from COSMC knockout material. Color intensity of squares reflect the ratio between the glycosylated and the non-glycosylated peptides as indication for site occupancy. Numbers above squares indicate the max. number of O-GalNAc glycans on the quantified peptide. Red boxes show isoform-specific sites (e.g. T2 for GalNAc-T2). All data in the figure represent averages of technical replicates (n = 3). Measures of technical variation can be found in the form of standard deviations represented by error bars (a), or in Supplementary Data 5.

