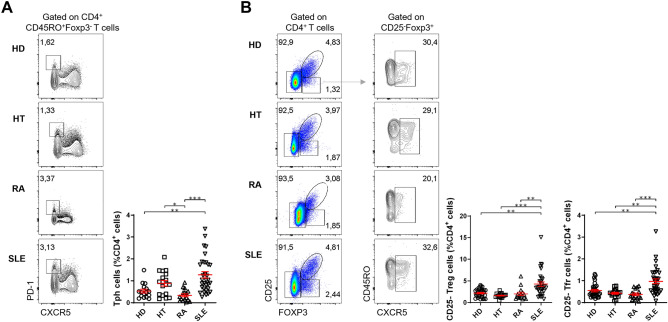
Figure 3.
SLE patients show an increased frequency of circulating Tph and CXCR5+CD25–Foxp3+ T follicular cells. Representative plots (left) and pooled data (right) of the frequency of (A) Tph cells and (B) CXCR5+CD25–Foxp3+ T cells in the peripheral blood of HT (n = 18), RA (n = 16), and SLE (n = 32) patients, and sex- and age-matched HD (A: n = 16; B: n = 31). Each data point represents an individual subject; bars represent mean ± SEM; *p < 0.05, **p < 0.01, ***p < 0.001, Kruskal–Wallis one-way analysis of variance (ANOVA) test with Dunn’s comparison post-test.

