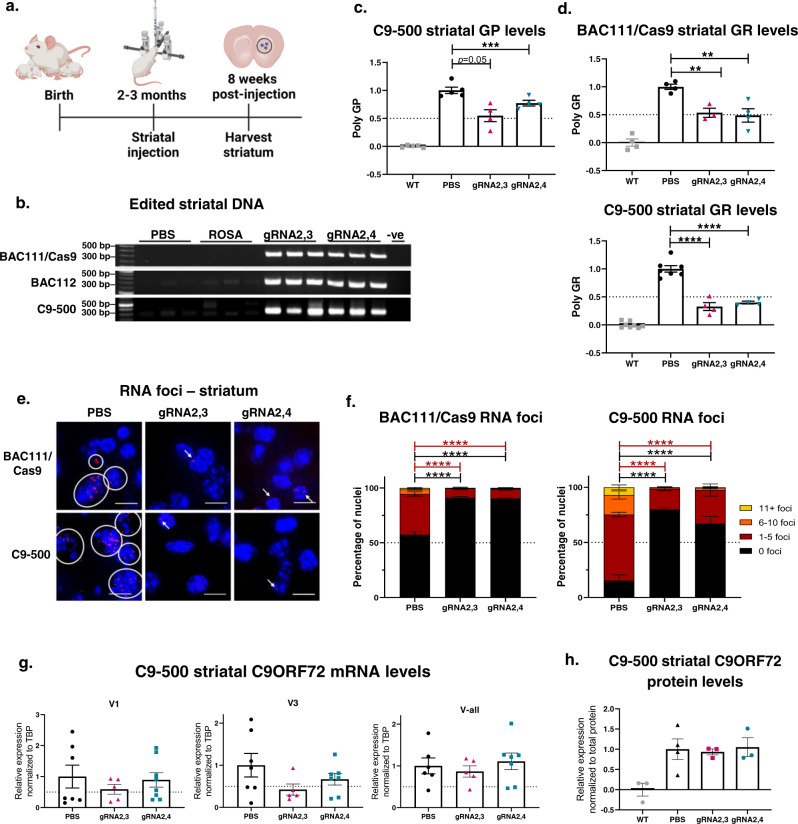
Fig. 3. In vivo gene editing results in a decrease of RNA foci and poly-dipeptides in different C9BAC-transgenic mouse models.
a Schematic of treatment and harvest of AAV9-delivered Cas9 and gRNA treatment of different C9ORF72 BAC-transgenic mouse models. Mice were treated at 2–4 months of age with bilateral striatal injections, and the striatums were harvested 8 weeks after treatment for further analyses. BAC111, BAC112, and C9-500 mice were treated with both AAV9–SpCas9 and AAV9-gRNA2,3 or AAV9-gRNA2,4 and BAC111/Cas9 mice with only AAV9-gRNA2,3 or AAV9-gRNA2,4. b Genomic DNA of treated BAC111/Cas9, BAC112, and C9-500 mouse striatums was amplified with primers flanking gRNA seed sequences, and PCR products were resolved by electrophoresis. The expected band for gRNA2,3- and gRNA2,4-edited DNA is 680 bps. No band is expected for unedited DNA. AAV9-Rosa treatment and PBS treatment were used as a control. Genomic DNA was amplified with primers flanking gRNA seed sequences, and PCR products resolved by electrophoresis. The expected band for gRNA2,3- and 2,4-edited DNA is 680 bps. No band is expected for unedited DNA. c Relative expression of poly-GP in the striatums of treated C9-500 mice. Data represent mean ± SEM, WT and PBS n = 5, treated groups n = 4, one-way ANOVA, Dunnett, P = 0.0502, ***P = 0.0004. d Relative expression of poly-GR in the striatums of treated BAC111/Cas9 and C9-500 mice. Data represent mean ± SEM, BAC111/Cas9 WT, PBS, gRNA2,4-treated mice n = 4, gRNA2,3 treated mice n = 3; C9-500 WT n = 6, PBS n = 7, both gRNA-treated groups n = 4, one-way ANOVA, Dunnett, **P = 0.0085 and 0.0026, ****P < 0.0001. e Representative images of sense RNA foci visualized by FISH in BAC111/Cas9 and C9-500 striatums treated with AAV9-gRNA2,3, AAV9-gRNA2,4, and PBS. Scale bars represent 10 μm. f Quantification of sense foci in treated BAC111/Cas9 and C9-500 mice striatums. Bar graph represents average percent of nuclei containing 0, 1–5, 6–10, and 11+ foci. n = 3 mice per group, and >600 nuclei were counted per sample. Two-way ANOVA, Tukey: ****P < 0.0001. g ddPCR analysis of mRNA expression levels of variants V1, V3, and all variants jointly (V-all) after gRNA2,3 and gRNA2,4 treatment in C9-500 mice. Expression levels were normalized to TBP and compared to the PBS-treated control. Mean ± SEM, PBS n = 7, gRNA2,3 n = 5, gRNA2,4 n = 8, one-way ANOVA, there were no significant differences between treated and untreated groups. h Densitometric quantification of the C9ORF72 long isoform in treated C9-500 mice. C9 protein levels were normalized against total protein levels. Levels from wild-type mice were averaged and subtracted as a background signal. Mean ± SEM, WT, gRNA2,3 and gRNA2,4 n = 3, PBS n = 4, one-way ANOVA, Dunnett, differences between PBS and gRNA2,3-, gRNA2,4-treated cells were not significant.

