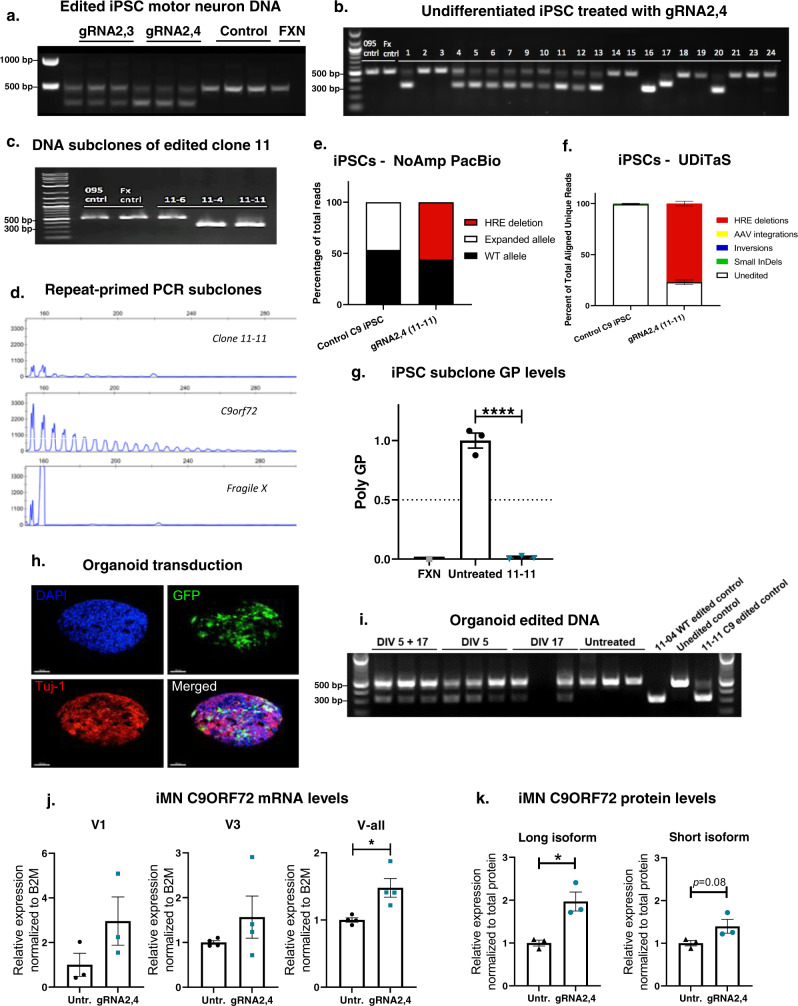
Fig. 5. Genome editing of the hexanucleotide repeat (G4C2)x expansion in C9ORF72 iPSCs and iMNs.
a C9ORF72 patient iPSC motor neurons transduced with Cas9 and gRNA2,3 and gRNA2,4. Genomic DNA was amplified with primers flanking gRNA seed sequences and PCR products resolved by electrophoresis. DNA isolated from Fragile X syndrome iPSC neurons (FXN) was used as a control. b Genome editing of undifferentiated C9ORF72 iPSCs with gRNA2,4. iPSCs were co-transduced with AAV–Cas9 and gRNA2,4, individual colonies (1–24) were manually selected and analyzed for genome editing by PCR using primers spanning the HRE. c Clone 11 selected from iPSCs transduced with Cas9 AAV and gRNA2,4 was subcloned to generate lines 11-6, 11–4, and 11-11. Analysis of genome editing revealed editing for subclones 11–4 and 11-11 but not 11-6, as indicted by a shift from 521 to 321 base pair product using primers that span the HRE. d Capillary electrophoresis fragment analysis of amplicons produced by repeat-primed PCR of the C9ORF72 HRE for subclone 11-6,11–4, 11-11, and FGX and untreated patient iPSCs. e Percentage of reads in which the HRE is excised in gRNA2,4-edited 11-11 isogenic iPSCs measured by No-Amp PacBio. f Composition of edited alleles at the gRNA2,4 editing loci in gRNA2,4-edited 11-11 isogenic iPSCs by UDiTaS analysis. The graphs show the percentage of HRE deletions, small InDels, AAV insertions, and inversions. Data represent mean ± SEM, n = 3. g Relative expression of poly-GP in the striatums of treated C9-500 mice. Data represent mean± SEM, n = 3 per experimental group, one-way ANOVA, Dunnett, ****P < 0.0001. h Representative confocal Z-stack images of organoid transduction. Organoids were stained for DAPI (blue) and immunolabeled with antibodies against Tuj-1 (red) and GFP (green). i Genomic DNA was isolated and amplified by PCR using primers spanning the C9ORF72 expansion after transduction by Cas9 and gRNA2,4 AAV vectors at 5 days, 5 and 17 days, 17 days or untransduced. DNA from edited iPSC subclones 11-04, 11-11, and DNA from one unedited line was used as controls. j ddPCR analysis of mRNA expression levels of variants V1, V3, and all variants jointly (V-all) in gRNA2,4-edited 11-11 isogenic iMNs. Expression levels were normalized to B2M and compared to untreated control patient iMNs. Mean ± SEM, n = 3, two-tailed Student’s t test, *P = 0.0158. k Densitometric quantification of the C9ORF72 long isoform and short isoform in gRNA2,4-edited 11-11 isogenic iMNs. C9 protein levels were normalized against total protein levels. Mean ± SEM, n = 3, two-tailed Student’s t test, P = 0.0844, *P = 0.0138.

