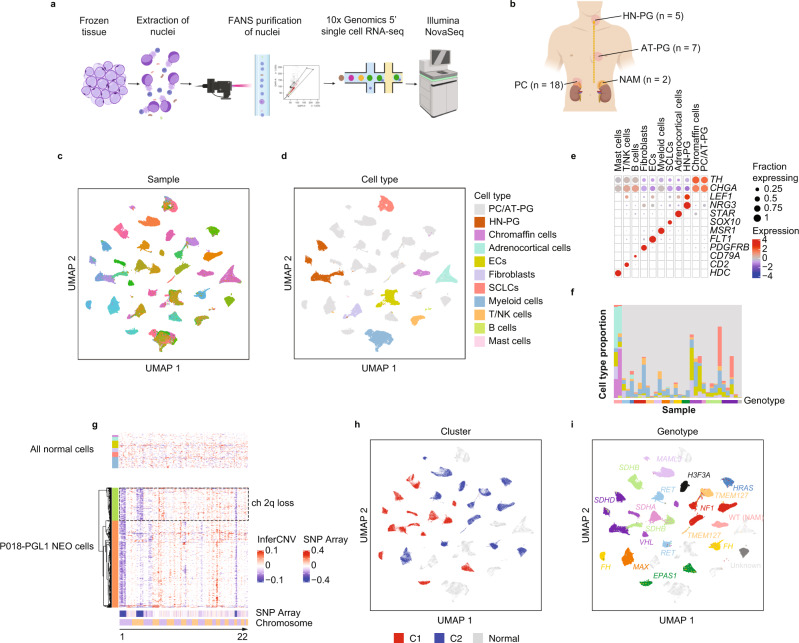
Fig. 1. snRNA-seq for cell type identification, inferred copy-number analysis and clustering of 30 PCPG and two NAM tissues.
a Schematic describing the workflow for single-nuclei isolation, Fluorescence-Activated Nuclei Sorting (FANS) and 5’ chemistry using the 10x platform starting from frozen tissues (created with BioRender.com). b Anatomical locations and sample size of tumors profiled with snRNA-seq (created with BioRender.com). c UMAP clustering of all nuclei from all samples colored by sample (individual color-sample key not shown, nSamples = 32). d UMAP clustering of all nuclei from all samples colored by cell type. ECs: Endothelial cells, SCLCs: Schwann cell-like cells. (nNuclei = 109,238). e Expression of major cell type markers in annotated UMAP clusters. Expression scale = Z-score standard deviations from mean. f Relative proportion of cell types detected in individual samples (cell type colored as per panel d). g Inferred copy-number in NEO and non-NEO cell types by gene-expression for an SDHB-associated AT-PG (P018-PGL3) (bottom panel; tumor cells with tumor subclones colored orange and green), top panel; non-neoplastic cell types from all tumors and NAM tissues with cell type colored as per panel d). InferCNV scale = modified expression, SNP array scale = log ratio. h UMAP clustering of all NEO nuclei from all samples colored and labeled by their known associated PCPG gene-expression subtype (C1/C2) (nNuclei = 109,238). i UMAP clustering with NEO nuclei labeled and colored by PCPG genotype (nNuclei = 109,238).

