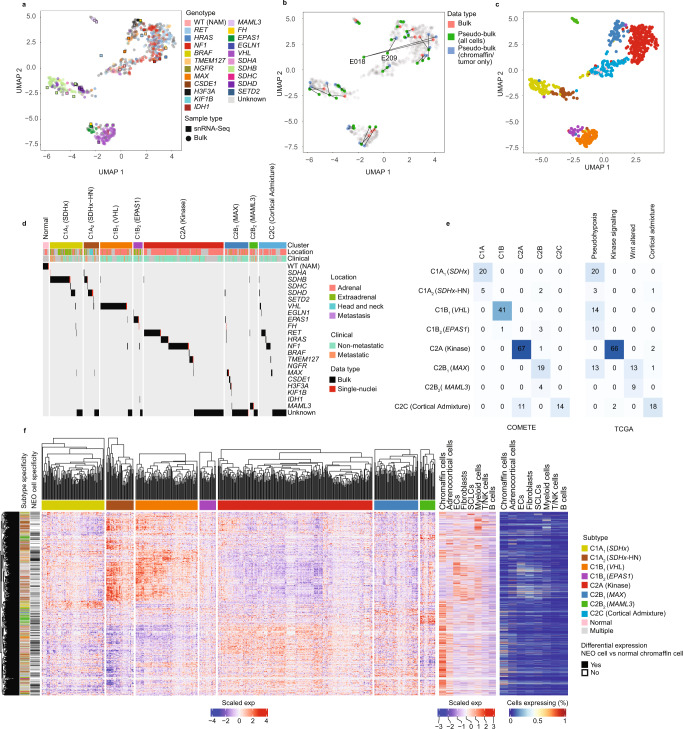
Fig. 2. PCPG subtyping by consensus clustering of bulk-tissue and pseudo-bulked snRNA-seq gene-expression data.
a UMAP projection of all bulk-tissue and snRNA-seq pseudo-bulked samples. Each dot represents an individual sample, colored by genotype (nBulk = 735, n-snRNA = 32) (WT (NAM): Wild-type normal adrenal medulla). b UMAP highlighting the relationships between paired bulk-tissue and pseudo-bulk snRNA-seq (NEO only and all cells). 14/32 samples analyzed with snRNA-seq had bulk-tissue gene-expression data available. Colors indicate the data type and data points from the same sample are linked by lines. (nBulk = 735, n-snRNA = 32) c UMAP illustrating tumor subtypes identified with consensus clustering, colored according to subtype as per panel d (nBulk = 735, n-snRNA = 32). d PCPG subtypes and gene driver mutations including bulk-tissue and pseudo-bulk snRNA-seq samples. Annotation bars indicate the tumor subtype and anatomical location of the primary tumor. Driver mutations, primary tumor anatomical location and metastatic status were derived from the publicly available metadata. Normal represents normal adrenal tissue. e Intersection of PCPG subtypes from this study with previous PCPG subtyping efforts, conducted by the COMETE10 (left panel) and TCGA (right panel) groups15. Cell numbers and color intensity indicate the number of overlapping samples. f PCPG subtype-specific DE genes, (identified with a bulk-tissue one subtype versus rest comparison, (absolute log2FC > 0.5, BH adj. P-value < 0.05) and intersecting tumor-specific gene expression (determined by pseudo-bulked NEO cells (one subtype) versus NAM chromaffin cell comparisons, absolute log2FC > 0.5, BH adj. P-value < 0.05). Left panel: Heatmap gene expression (Z-score, standard deviations from the mean) for genes found DE bulk-tissue RNA data (nGenes = 4367, nSamples = 628). Far left annotation bar shows DE genes color-coded by the associated subtype. Black bar indicates if genes were DE in the NEO vs NAM chromaffin cell comparison (in at least one case where a gene is significant in >1 comparison). Right panel: Expression of DE PCPG subtype genes in the non-neoplastic cell types from snRNA-seq data. Plot on left showing z-score scaled expression for pseudo-bulk data and plot on the right showing fraction of cells expressing the gene.

