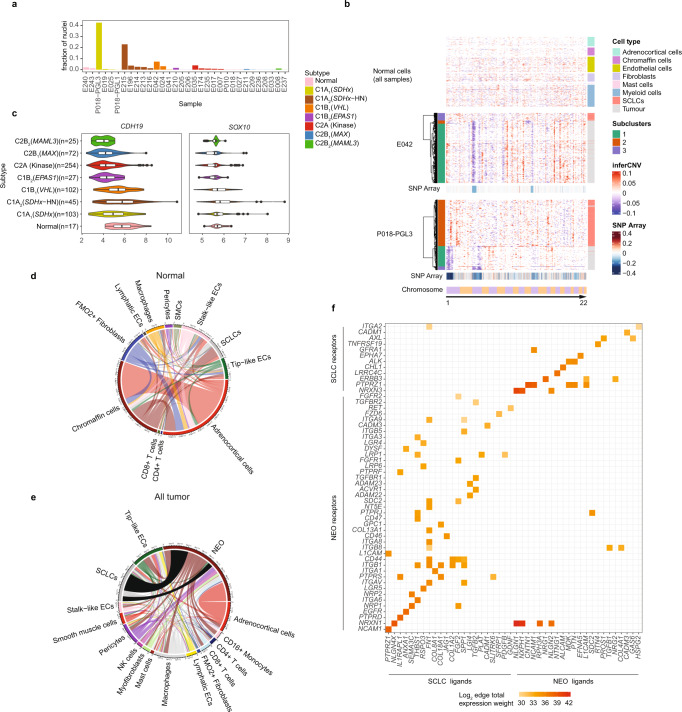
Fig. 5. SCLCs and cell-signaling in PCPG and NAM tissues.
a Fraction of SCLCs among all cells detected in PCPG tumors by snRNA-seq. b Inferred copy-number and clustering of NEO and SCLC populations in two PCPG tumors (E042, P018-PGL3) (bottom panels; clustered tumor cells and SCLCs, top panel; non-neoplastic cell types excluding SCLCs from all tumors and normal tissues). InferCNV scale = modified expression, SNP array scale = log ratio. c Gene-expression of SCLC marker genes CDH19 and SOX10 in bulk-tissue data (nSamples = 645, the lower and upper hinges of each boxplot correspond to the first and third quartiles, respectively, and the median value is marked. The whiskers extend to the largest and smallest value not greater than 1.5 times the interquartile range above or below the upper and lower hinges, respectively. Values beyond the whisker extents are deemed outliers and are plotted individually). Chord plots of NATMI mean edge total expression weights showing the average of the total amount of inferred signaling between all cell types in d, NAM samples and e, PCPG tumor samples. f Mean edge total expression weight of ligands and receptors expressed by SCLCs and their known target receptors and ligands on tumor cells. SCLCs ligands and receptors were DE in SCLCs vs the rest of normal cells at log2FC > 3, BH adj. P-value < 0.05).

