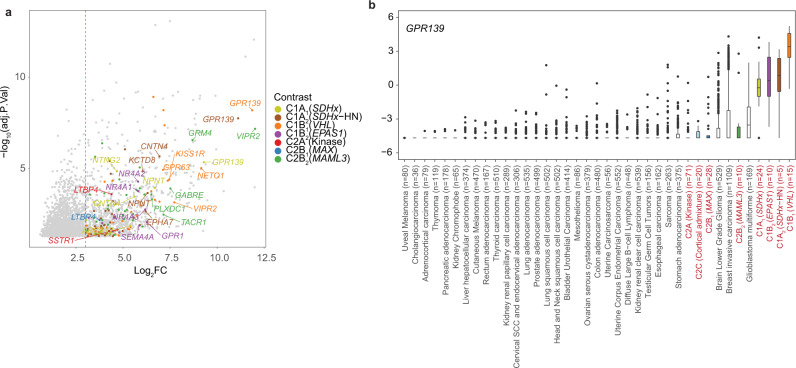
Fig. 7. Identification cell surface receptors as putative therapeutic targets.
a Volcano-plot showing significantly DE genes (adj. p-value < 0.05) found by contrasting pseudo-bulked NEO cells and NAM chromaffin cells based on PCPG subtype (Supplementary Data 5). Only those genes encoding cell surface receptors are colored, with top receptors in each PCPG subtype labeled. The dotted line shows log2 threefold change threshold used for selecting receptor genes. b Expression of GPR139 across tumor types in the TCGA pan-cancer dataset of 10,211 tumors from 32 cancer types. PCPG are colored by their respective subtype. WT (NAM): Wild type normal adrenal medulla (The lower and upper hinges of each boxplot correspond to the first and third quartiles, respectively, and the median value is marked. The whiskers extend to the largest and smallest value not greater than 1.5 times the interquartile range above or below the upper and lower hinges, respectively. Values beyond the whisker extents are deemed outliers and are plotted individually).

