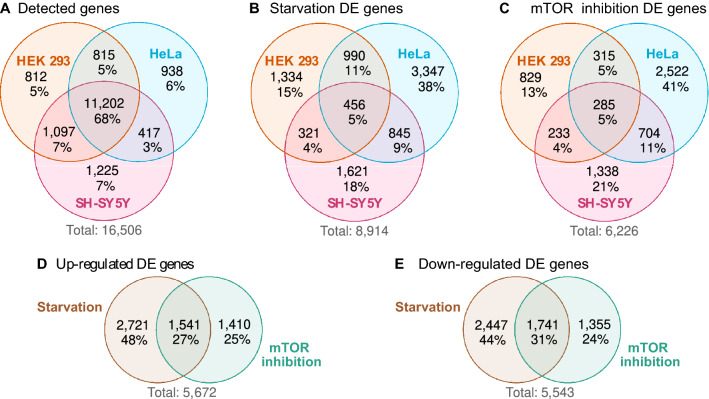
Figure 1.
Overview of differentially expressed (DE) genes. (A) Genes were considered detectable if there were > 1.5 counts per million in > 3 samples out of all samples from the same cell line. (B) Genes that were DE between starved and control samples in at least one cell line. (C) Genes that were DE between mTOR inhibited and control samples in at least one cell line. (D) We collected DE genes associated with starvation or mTOR inhibition that were up-regulated in at least one cell line (inconsistent DE genes that were significantly up-regulated in one cell line but significantly down-regulated in another were excluded). (E) Down-regulated DE genes associated with starvation or mTOR inhibition.

