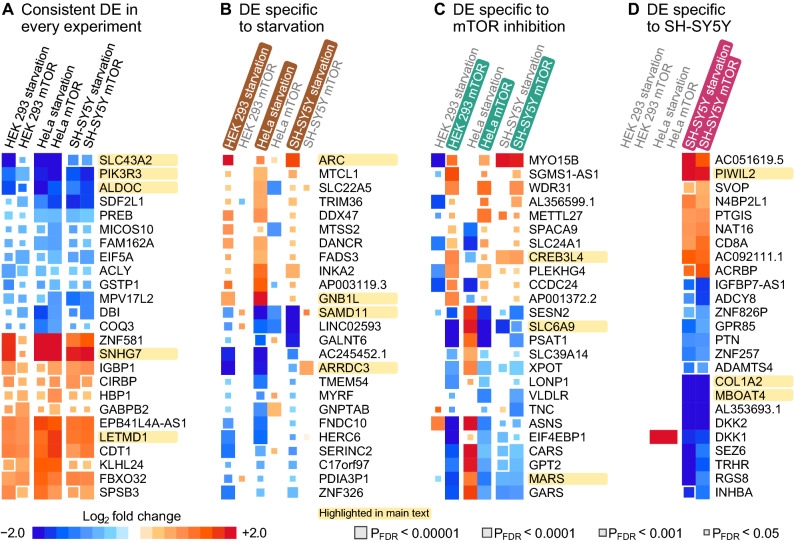
Figure 2.
Top 25 differentially expressed (DE) genes based on the maximum FDR rule. Genes mentioned in the main text are highlighted for easier visual localization. (A) Genes were sorted according to the maximum FDR-adjusted P-value across six experiments. Discordant genes that were significantly (PFDR < 5%) up-regulated in one and down-regulated in another experiment were excluded. (B) Genes were sorted according to the maximum PFDR across all starvation experiments. We also required that all starvation responses were directionally concordant and that the mean log2 fold change across mTOR experiments was in the opposite direction. (C) Genes were sorted according to the maximum PFDR across all mTOR inhibition experiments. We required that all mTOR inhibition responses were directionally concordant and that the mean log2 fold change across starvation experiments was in the opposite direction. (D) Genes were sorted according to the maximum PFDR across responses in the SH-SY5Y cells. Missing signals were set to zero log2 fold change in other cell lines. We also required that the mean log2 fold changes in other cells were in the opposite direction to SH-SY5Y responses.

