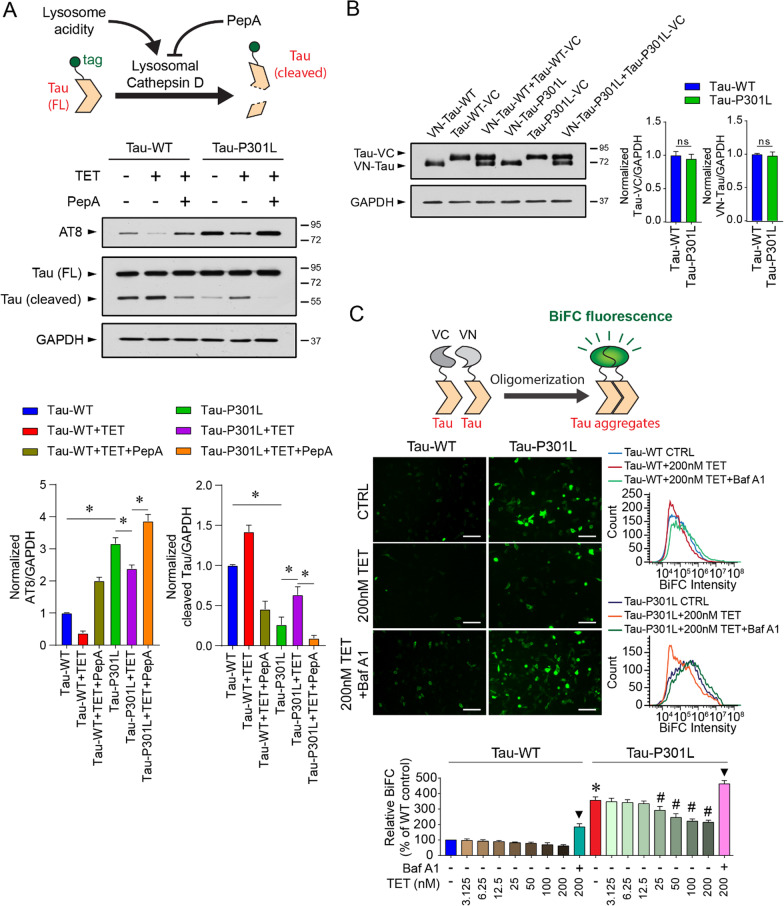
Fig. 4.
Tetrandrine ameliorates tau aggregation through endolysosomal degradation. A Top, schematic representation showing the manipulation of cathepsin D activity by tetrandrine or pepstatin A (Pep A) on the aggregation of tagged-tau ion SH-SY5Y cells. Middle, Western blot analyses of tau aggregation under the influence of tetrandrine and pepstatin A in Tau-WT- or Tau-301L-expressing SH-SY5Y cells. Cathepsin D activity was modulated by the addition of tetrandrine (TET) or Pep A. Bar charts depict the protein amount of cleaved and uncleaved tau normalized to GAPDH. Data are summarized as the mean ± SEM from 3 individual experiments; *Indicates p < 0.05. B Western blot analysis of the expression levels of VN and VC fragments of biomolecular fluorescence complementation (BiFC) in Tau-WT- or Tau-P301L-expressing cells. The bar chart depicts the protein levels of VN-tagged and VC-tagged tau when they were coexpressed. Expression of Tau-WT or Tau-P301L did not affect the expression of VN- and VC-fragments in cells. Data are summarized as the mean ± SEM from 3 individual experiments. n.s. denotes no statistical significance. C Top, a schematic showing the formation of BiFC by the expressed VN- and VC-fragments. Middle, representative micrographs showing the fluorescence levels of BiFC in Tau-WT- or Tau-P301L-expressing cells under the influence of tetrandrine with or without BafA1 cotreatment. Bottom, representative flow cytometry data depict the effect of tetrandrine (TET) or Baf A1 on tau aggregation. The bar chart depicts data summarized as the mean ± SEM from 3 individual experiments; * and #Indicate p < 0.05 compared to the WT and untreated mutant tau groups, respectively. ▼ indicates p < 0.05 compared to the 200 nM tetrandrine-treated groups

