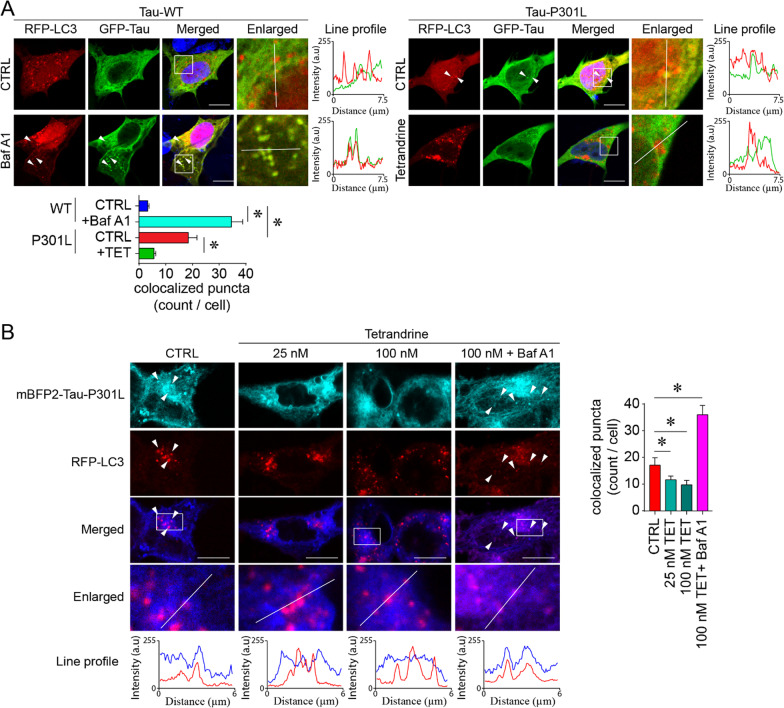
Fig. 5.
Tetrandrine promotes pathological tau degradation. A Representative micrographs showing autophagic degradation of tau tracked by GFP-Tau and RFP-LC3 in Tau-WT- or Tau-P301L-expressing SH-SY5Y cells. The enlarged images are the magnified regions indicated in the white boxes of the merged images. White arrowheads indicate the colocalization of tau and LC3 puncta, and their degree of colocalization was analysed by ImageJ with the colocalization analysis plugin. The red and green traces in the line profile show the intensity of red and green colour in arbitrary units (a.u.) along the white line indicated in the enlarged images. The bar chart depicts data summarized as the mean ± SEM from 3 individual experiments, with 30 cells counted in each group. *Indicates p < 0.05. B An analogous tau degradation experiment was performed using acid-resistant mBFP2-tagged tau P301L. The enlarged images are the magnified region indicated by the white boxes in the merged images. White arrowheads indicate the colocalization of tau-P301L—LC3 puncta under the influence of tetrandrine (TET) and bafilomycin A (BafA1). The degree of colocalization was analysed with ImageJ. The red and blue traces in the line profile show the intensity of red and blue colour in arbitrary units (a.u.) along the white line indicated in the enlarged images. The bar chart depicts data summarized as the mean ± SEM from 3 individual experiments, with 30 cells counted in each group. *Indicates p < 0.05

