Fig. 1.
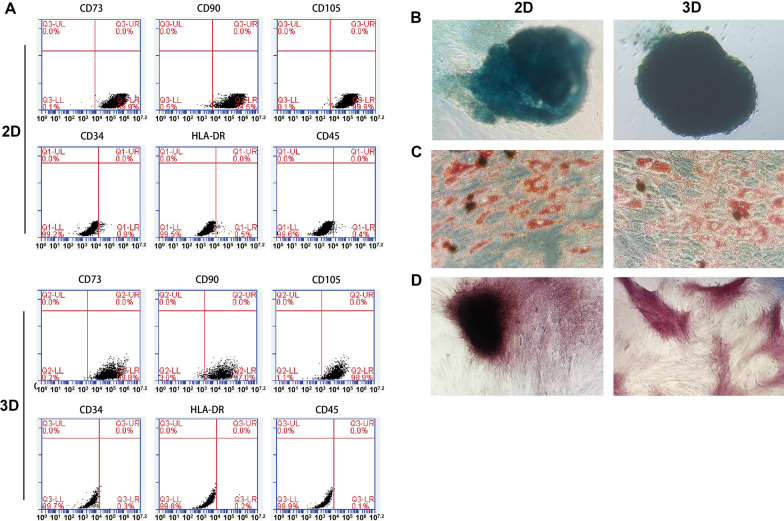
Characterization of MSCs. A Flow cytometry analysis of MSCs. MSCs at passage 5 before (2D) and after 3D culture were subjected to flow cytometry analysis for cell surface expression of different proteins as indicated. 3D cultured MSCs were dispersed into single cells by trypsinization before analysis. B–D Single-cell suspensions of 2D and 3D cultured MSCs were cultured in corresponding inductive media for chondrogenesis, adipogenesis and osteogenesis, for 14 days. In chondrogenic culture, cells tended to form aggregates, which were blue after Alcian Blue staining (B). In adipogenic culture, lipids in adipocytes were red after oil red staining (C). In osteogenic culture, mineral deposition was red after Alizarin Red S staining (D)

