
Figure 3.
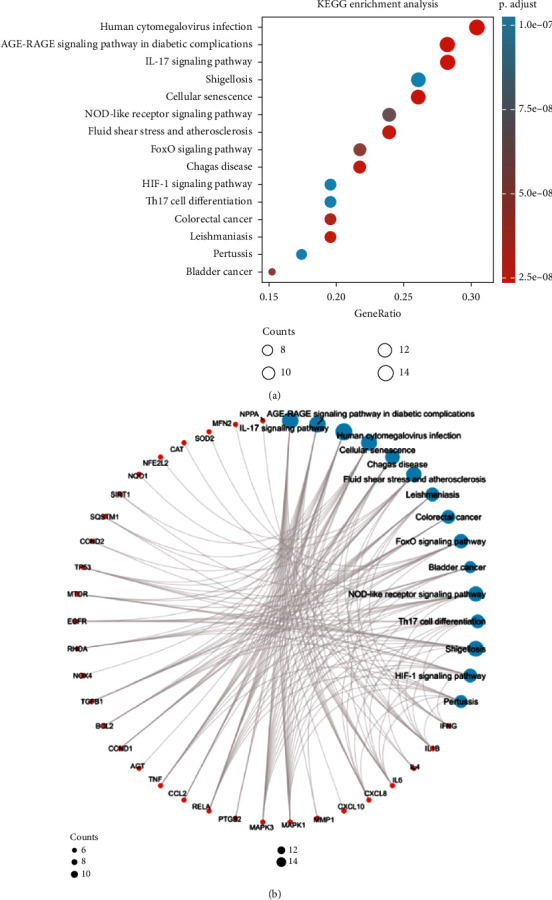
KEGG enrichment analysis of 46 intersection targets. The results of KEGG were presented by bubble (a) and circle (b) charts.
Official websites use .gov
A
.gov website belongs to an official
government organization in the United States.
Secure .gov websites use HTTPS
A lock (
) or https:// means you've safely
connected to the .gov website. Share sensitive
information only on official, secure websites.
KEGG enrichment analysis of 46 intersection targets. The results of KEGG were presented by bubble (a) and circle (b) charts.